|
Download Data (XLS File) |
|
||||||||
|
||||||||
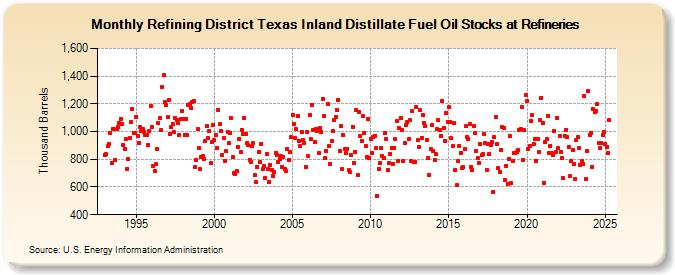
| Refining District Texas Inland Distillate Fuel Oil Stocks at Refineries (Thousand Barrels) | ||||||||
| Year | Jan | Feb | Mar | Apr | May | Jun | Jul | Aug | Sep | Oct | Nov | Dec |
|---|---|---|---|---|---|---|---|---|---|---|---|---|
| 1993 | 828 | 835 | 893 | 911 | 991 | 772 | 1,020 | 1,018 | 795 | 1,018 | 1,031 | 1,060 |
| 1994 | 1,094 | 1,051 | 903 | 877 | 943 | 730 | 799 | 952 | 1,067 | 1,166 | 988 | 988 |
| 1995 | 1,108 | 971 | 916 | 1,034 | 1,003 | 1,022 | 995 | 972 | 972 | 903 | 1,001 | 1,183 |
| 1996 | 1,036 | 748 | 713 | 764 | 871 | 1,060 | 1,099 | 1,010 | 1,318 | 1,406 | 1,210 | 1,188 |
| 1997 | 1,103 | 1,228 | 981 | 1,033 | 1,057 | 994 | 1,101 | 1,083 | 1,059 | 974 | 1,087 | 1,151 |
| 1998 | 1,093 | 977 | 1,094 | 976 | 1,192 | 1,198 | 1,172 | 1,211 | 1,222 | 744 | 793 | 1,017 |
| 1999 | 878 | 727 | 815 | 821 | 803 | 933 | 1,039 | 953 | 1,007 | 774 | 927 | 1,049 |
| 2000 | 937 | 973 | 884 | 1,158 | 1,055 | 1,007 | 834 | 954 | 788 | 857 | 1,000 | 915 |
| 2001 | 990 | 1,101 | 813 | 701 | 695 | 712 | 891 | 944 | 856 | 1,014 | 985 | 1,096 |
| 2002 | 984 | 915 | 900 | 797 | 780 | 897 | 916 | 684 | 639 | 747 | 853 | 778 |
| 2003 | 907 | 727 | 750 | 666 | 839 | 732 | 637 | 759 | 726 | 679 | 706 | 848 |
| 2004 | 833 | 778 | 799 | 825 | 747 | 815 | 733 | 713 | 874 | 798 | 854 | 958 |
| 2005 | 1,122 | 1,057 | 950 | 1,015 | 1,109 | 935 | 894 | 1,000 | 937 | 915 | 747 | 999 |
| 2006 | 821 | 1,120 | 947 | 1,193 | 1,014 | 925 | 1,015 | 1,004 | 846 | 1,028 | 999 | 1,236 |
| 2007 | 1,114 | 809 | 860 | 1,201 | 895 | 768 | 932 | 1,005 | 1,085 | 1,106 | 1,157 | 1,230 |
| 2008 | 859 | 1,037 | 729 | 974 | 872 | 845 | 874 | 723 | 707 | 828 | 1,036 | 776 |
| 2009 | 853 | 1,159 | 688 | 1,142 | 966 | 933 | 1,111 | 991 | 897 | 819 | 1,090 | 810 |
| 2010 | 947 | 847 | 959 | 968 | 879 | 537 | 728 | 772 | 882 | 826 | 811 | 988 |
| 2011 | 949 | 726 | 772 | 839 | 882 | 768 | 881 | 943 | 1,075 | 785 | 1,025 | 1,096 |
| 2012 | 1,009 | 790 | 918 | 1,044 | 1,067 | 944 | 1,083 | 785 | 1,147 | 781 | 781 | 1,174 |
| 2013 | 936 | 891 | 1,153 | 957 | 1,121 | 1,059 | 1,041 | 937 | 812 | 683 | 877 | 1,049 |
| 2014 | 861 | 796 | 837 | 1,015 | 1,085 | 1,013 | 967 | 1,222 | 1,028 | 932 | 1,137 | 1,069 |
| 2015 | 1,174 | 1,069 | 950 | 897 | 1,060 | 725 | 611 | 785 | 899 | 846 | 735 | 743 |
| 2016 | 874 | 1,037 | 961 | 947 | 1,058 | 742 | 723 | 1,038 | 986 | 860 | 810 | 773 |
| 2017 | 911 | 828 | 838 | 981 | 921 | 726 | 911 | 839 | 901 | 927 | 567 | 958 |
| 2018 | 1,106 | 911 | 739 | 710 | 870 | 1,030 | 1,024 | 650 | 754 | 620 | 803 | 968 |
| 2019 | 629 | 785 | 842 | 842 | 850 | 867 | 1,011 | 1,022 | 1,180 | 798 | 1,008 | 1,267 |
| 2020 | 1,223 | 877 | 897 | 1,078 | 1,116 | 911 | 945 | 788 | 948 | 855 | 1,086 | 1,244 |
| 2021 | 1,061 | 632 | 924 | 944 | 1,112 | 843 | 898 | 848 | 833 | 1,003 | 854 | 1,096 |
| 2022 | 878 | 967 | 854 | 812 | 667 | 967 | 1,013 | 959 | 889 | 677 | 787 | 866 |
| 2023 | 766 | 645 | 951 | 959 | 879 | 760 | 786 | 766 | 1,257 | 655 | 863 | 1,292 |
| 2024 | 977 | 990 | 742 | 1,160 | ||||||||
| - = No Data Reported; -- = Not Applicable; NA = Not Available; W = Withheld to avoid disclosure of individual company data. |
| Release Date: 6/28/2024 |
| Next Release Date: 7/31/2024 |
Referring Pages: