|
Download Data (XLS File) |
|
||||||||
|
||||||||
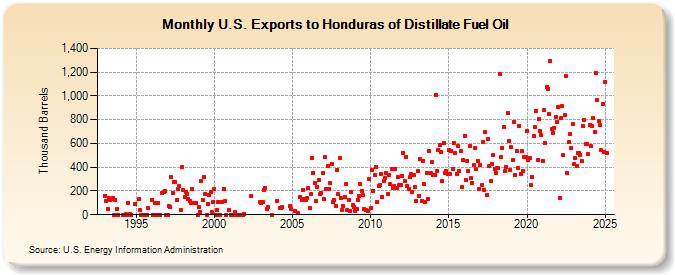
| U.S. Exports to Honduras of Distillate Fuel Oil (Thousand Barrels) | ||||||||
| Year | Jan | Feb | Mar | Apr | May | Jun | Jul | Aug | Sep | Oct | Nov | Dec |
|---|---|---|---|---|---|---|---|---|---|---|---|---|
| 1993 | 160 | 119 | 50 | 137 | 124 | 136 | 137 | 1 | 125 | 50 | 0 | |
| 1994 | 0 | 2 | 0 | 101 | 2 | 1 | 94 | |||||
| 1995 | 130 | 40 | 1 | 1 | 0 | 1 | 53 | |||||
| 1996 | 125 | 0 | 96 | 1 | 1 | 100 | 0 | 182 | 193 | 201 | 0 | |
| 1997 | 1 | 72 | 63 | 319 | 183 | 272 | 279 | 125 | 219 | 241 | 41 | 401 |
| 1998 | 205 | 152 | 188 | 175 | 131 | 117 | 100 | 218 | 100 | 97 | 0 | |
| 1999 | 61 | 26 | 283 | 124 | 318 | 176 | 1 | 91 | 162 | 187 | 24 | 111 |
| 2000 | 220 | 1 | 38 | 111 | 0 | 110 | 219 | 112 | 0 | 40 | ||
| 2001 | 0 | 1 | 0 | 25 | 0 | 0 | 0 | 0 | 3 | |||
| 2002 | 155 | 109 | ||||||||||
| 2003 | 96 | 108 | 207 | 227 | 44 | 61 | 1 | |||||
| 2004 | 117 | 57 | 60 | 69 | 71 | 48 | ||||||
| 2005 | 30 | 11 | 148 | 125 | 208 | 130 | 125 | 140 | ||||
| 2006 | 223 | 54 | 171 | 478 | 354 | 268 | 119 | 232 | 290 | 173 | 184 | 354 |
| 2007 | 129 | 482 | 219 | 408 | 217 | 264 | 431 | 105 | 121 | 75 | 378 | 173 |
| 2008 | 481 | 143 | 40 | 70 | 150 | 260 | 42 | 124 | 33 | 188 | 81 | 66 |
| 2009 | 35 | 50 | 124 | 156 | 255 | 199 | 163 | 49 | 42 | 35 | 299 | |
| 2010 | 58 | 375 | 202 | 334 | 403 | 105 | 240 | 248 | 346 | 150 | 283 | 312 |
| 2011 | 347 | 175 | 335 | 256 | 383 | 227 | 238 | 389 | 222 | 318 | 246 | 250 |
| 2012 | 330 | 522 | 286 | 484 | 241 | 219 | 315 | 341 | 189 | 331 | 233 | 117 |
| 2013 | 366 | 161 | 467 | 118 | 450 | 256 | 111 | 355 | 129 | 533 | 351 | 445 |
| 2014 | 332 | 333 | 1,008 | 367 | 545 | 586 | 530 | 283 | 606 | 353 | 368 | 342 |
| 2015 | 548 | 343 | 540 | 384 | 605 | 521 | 342 | 575 | 370 | 536 | 231 | 459 |
| 2016 | 665 | 294 | 453 | 372 | 580 | 305 | 268 | 415 | 563 | 382 | 456 | 213 |
| 2017 | 422 | 249 | 608 | 209 | 700 | 166 | 640 | 412 | 282 | 424 | 501 | 381 |
| 2018 | 353 | 392 | 391 | 1,182 | 483 | 563 | 741 | 364 | 405 | 852 | 619 | 375 |
| 2019 | 568 | 463 | 781 | 336 | 535 | 393 | 746 | 343 | 537 | 365 | 482 | 484 |
| 2020 | 706 | 457 | 479 | 249 | 320 | 664 | 736 | 877 | 462 | 802 | 707 | 667 |
| 2021 | 454 | 879 | 600 | 1,077 | 1,061 | 844 | 1,295 | 724 | 691 | 734 | 820 | 782 |
| 2022 | 908 | 142 | 812 | 914 | 499 | 840 | 1,169 | 353 | 612 | 680 | 562 | 762 |
| 2023 | 434 | 475 | 485 | 527 | 520 | 503 | 454 | 733 | 801 | 598 | 592 | 507 |
| 2024 | 759 | |||||||||||
| - = No Data Reported; -- = Not Applicable; NA = Not Available; W = Withheld to avoid disclosure of individual company data. |
| Release Date: 3/29/2024 |
| Next Release Date: 4/30/2024 |