|
Download Data (XLS File) |
|
||||||||
|
||||||||
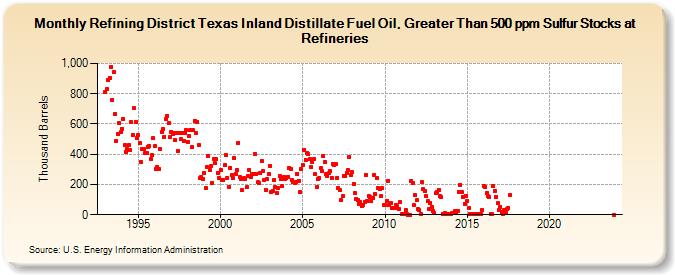
| Refining District Texas Inland Distillate Fuel Oil, Greater Than 500 ppm Sulfur Stocks at Refineries (Thousand Barrels) | ||||||||
| Year | Jan | Feb | Mar | Apr | May | Jun | Jul | Aug | Sep | Oct | Nov | Dec |
|---|---|---|---|---|---|---|---|---|---|---|---|---|
| 1993 | 814 | 832 | 891 | 904 | 980 | 761 | 943 | 665 | 488 | 532 | 606 | 545 |
| 1994 | 569 | 636 | 458 | 412 | 434 | 459 | 428 | 614 | 529 | 703 | 614 | 509 |
| 1995 | 528 | 472 | 349 | 433 | 436 | 409 | 408 | 450 | 455 | 370 | 394 | 504 |
| 1996 | 452 | 303 | 318 | 305 | 432 | 549 | 568 | 517 | 632 | 654 | 606 | 511 |
| 1997 | 549 | 537 | 543 | 495 | 538 | 424 | 540 | 500 | 543 | 487 | 543 | 560 |
| 1998 | 484 | 519 | 557 | 446 | 557 | 622 | 543 | 616 | 460 | 240 | 250 | 236 |
| 1999 | 276 | 178 | 313 | 391 | 293 | 322 | 211 | 368 | 339 | 368 | 276 | 244 |
| 2000 | 294 | 227 | 229 | 327 | 395 | 242 | 185 | 311 | 260 | 240 | 375 | 268 |
| 2001 | 295 | 476 | 248 | 237 | 166 | 240 | 237 | 180 | 253 | 295 | 249 | 271 |
| 2002 | 267 | 403 | 271 | 214 | 207 | 274 | 356 | 287 | 228 | 163 | 235 | 269 |
| 2003 | 324 | 152 | 158 | 231 | 183 | 144 | 177 | 254 | 233 | 188 | 252 | 233 |
| 2004 | 240 | 252 | 309 | 305 | 230 | 214 | 208 | 216 | 268 | 225 | 148 | 300 |
| 2005 | 330 | 430 | 364 | 407 | 404 | 366 | 313 | 351 | 371 | 268 | 183 | 234 |
| 2006 | 243 | 306 | 287 | 385 | 351 | 270 | 255 | 274 | 288 | 246 | 338 | 329 |
| 2007 | 333 | 246 | 174 | 161 | 95 | 122 | 258 | 253 | 279 | 294 | 382 | 261 |
| 2008 | 280 | 204 | 143 | 104 | 98 | 74 | 83 | 55 | 66 | 84 | 264 | 93 |
| 2009 | 121 | 115 | 89 | 109 | 262 | 138 | 240 | 174 | 169 | 122 | 174 | 63 |
| 2010 | 64 | 90 | 226 | 62 | 76 | 44 | 47 | 44 | 66 | 57 | 37 | 84 |
| 2011 | 3 | 6 | 2 | 29 | 5 | 1 | 1 | 224 | 211 | 64 | 129 | 95 |
| 2012 | 36 | 29 | 6 | 214 | 167 | 160 | 121 | 88 | 35 | 80 | 51 | 26 |
| 2013 | 13 | 142 | 147 | 165 | 123 | 115 | 6 | 6 | 9 | 2 | 4 | 7 |
| 2014 | 8 | 10 | 13 | 24 | 16 | 25 | 152 | 199 | 148 | 116 | 73 | 126 |
| 2015 | 92 | 43 | 5 | 6 | 8 | 8 | 6 | 4 | 5 | 6 | 8 | 31 |
| 2016 | 193 | 185 | 143 | 123 | 120 | 7 | 6 | 187 | 158 | 120 | 75 | 29 |
| 2017 | 53 | 16 | 4 | 34 | 9 | 36 | 45 | 133 | ||||
| 2023 | 1 | |||||||||||
| - = No Data Reported; -- = Not Applicable; NA = Not Available; W = Withheld to avoid disclosure of individual company data. |
| Release Date: 6/28/2024 |
| Next Release Date: 7/31/2024 |