|
Download Data (XLS File) |
|
||||||||
|
||||||||
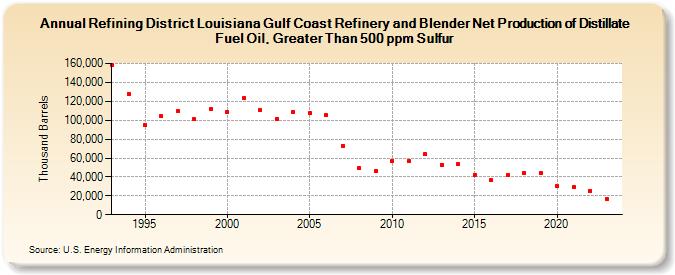
| Refining District Louisiana Gulf Coast Refinery and Blender Net Production of Distillate Fuel Oil, Greater Than 500 ppm Sulfur (Thousand Barrels) | ||||||||
| Decade | Year-0 | Year-1 | Year-2 | Year-3 | Year-4 | Year-5 | Year-6 | Year-7 | Year-8 | Year-9 |
|---|---|---|---|---|---|---|---|---|---|---|
| 1990's | 157,927 | 127,839 | 95,119 | 104,135 | 109,517 | 100,921 | 112,057 | |||
| 2000's | 108,447 | 123,144 | 110,446 | 101,493 | 108,712 | 107,393 | 105,288 | 72,974 | 49,276 | 45,814 |
| 2010's | 56,963 | 56,704 | 63,768 | 52,960 | 53,259 | 42,534 | 36,771 | 41,953 | 44,383 | 44,023 |
| 2020's | 30,384 | 29,178 | 25,472 | 16,742 |
| - = No Data Reported; -- = Not Applicable; NA = Not Available; W = Withheld to avoid disclosure of individual company data. |
| Release Date: 6/28/2024 |
| Next Release Date: 8/30/2024 |