|
Download Data (XLS File) |
|
||||||||
|
||||||||
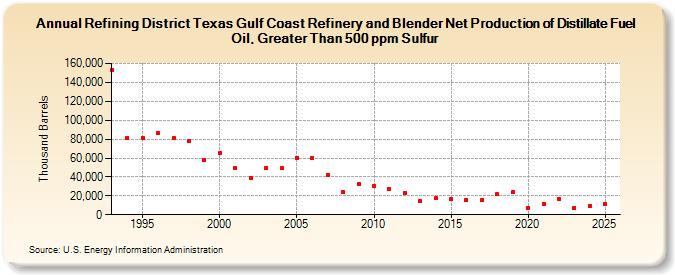
| Refining District Texas Gulf Coast Refinery and Blender Net Production of Distillate Fuel Oil, Greater Than 500 ppm Sulfur (Thousand Barrels) | ||||||||
| Decade | Year-0 | Year-1 | Year-2 | Year-3 | Year-4 | Year-5 | Year-6 | Year-7 | Year-8 | Year-9 |
|---|---|---|---|---|---|---|---|---|---|---|
| 1990's | 152,593 | 81,439 | 81,603 | 86,213 | 81,373 | 77,988 | 58,126 | |||
| 2000's | 65,020 | 49,070 | 39,239 | 49,818 | 49,626 | 60,510 | 59,942 | 42,277 | 23,641 | 32,279 |
| 2010's | 30,726 | 27,662 | 22,984 | 14,762 | 17,399 | 16,684 | 15,796 | 15,110 | 21,610 | 23,716 |
| 2020's | 7,540 | 11,176 | 16,128 | 7,505 |
| - = No Data Reported; -- = Not Applicable; NA = Not Available; W = Withheld to avoid disclosure of individual company data. |
| Release Date: 8/30/2024 |
| Next Release Date: 8/29/2025 |