|
Download Data (XLS File) |
|
||||||||
|
||||||||
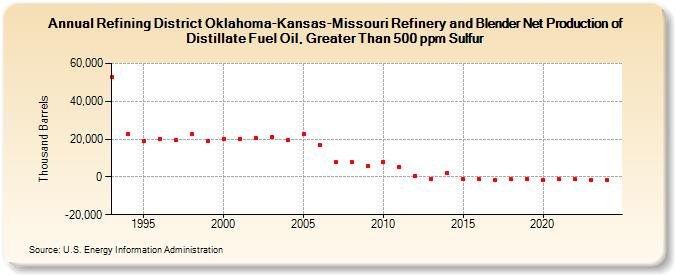
| Refining District Oklahoma-Kansas-Missouri Refinery and Blender Net Production of Distillate Fuel Oil, Greater Than 500 ppm Sulfur (Thousand Barrels) | ||||||||
| Decade | Year-0 | Year-1 | Year-2 | Year-3 | Year-4 | Year-5 | Year-6 | Year-7 | Year-8 | Year-9 |
|---|---|---|---|---|---|---|---|---|---|---|
| 1990's | 52,720 | 22,589 | 18,786 | 20,110 | 19,388 | 22,486 | 18,731 | |||
| 2000's | 20,171 | 20,131 | 20,357 | 20,995 | 19,260 | 22,665 | 17,034 | 7,686 | 8,137 | 5,728 |
| 2010's | 8,126 | 5,414 | 512 | -936 | 2,096 | -1,337 | -1,249 | -1,509 | -1,336 | -1,045 |
| 2020's | -1,489 | -1,245 | -1,273 | -1,429 |
| - = No Data Reported; -- = Not Applicable; NA = Not Available; W = Withheld to avoid disclosure of individual company data. |
| Release Date: 6/28/2024 |
| Next Release Date: 8/30/2024 |