|
Download Data (XLS File) |
|
||||||||
|
||||||||
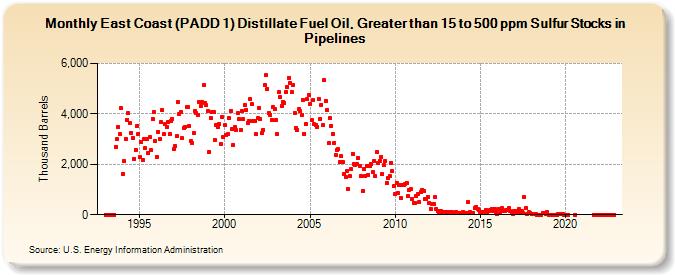
| East Coast (PADD 1) Distillate Fuel Oil, Greater than 15 to 500 ppm Sulfur Stocks in Pipelines (Thousand Barrels) | ||||||||
| Year | Jan | Feb | Mar | Apr | May | Jun | Jul | Aug | Sep | Oct | Nov | Dec |
|---|---|---|---|---|---|---|---|---|---|---|---|---|
| 1993 | 3 | 3 | 3 | 3 | 3 | 3 | 3 | 2,699 | 2,997 | 3,472 | 3,192 | 4,215 |
| 1994 | 1,610 | 2,125 | 3,022 | 3,774 | 4,029 | 3,633 | 3,254 | 3,046 | 2,216 | 2,579 | 3,530 | 3,192 |
| 1995 | 2,289 | 2,868 | 2,187 | 2,986 | 2,638 | 2,998 | 2,466 | 3,071 | 2,555 | 3,805 | 4,080 | 2,908 |
| 1996 | 2,309 | 3,284 | 3,002 | 3,660 | 4,147 | 3,208 | 3,610 | 3,480 | 3,680 | 3,201 | 3,737 | 3,790 |
| 1997 | 2,591 | 2,722 | 3,119 | 4,470 | 4,010 | 4,057 | 3,026 | 3,440 | 3,481 | 4,260 | 4,256 | 3,529 |
| 1998 | 2,905 | 2,833 | 3,233 | 4,117 | 4,037 | 3,974 | 4,470 | 4,320 | 4,453 | 5,133 | 4,449 | 4,343 |
| 1999 | 4,121 | 2,500 | 3,851 | 4,057 | 4,074 | 2,965 | 3,547 | 3,471 | 3,595 | 2,798 | 3,880 | 3,072 |
| 2000 | 3,543 | 3,181 | 3,193 | 3,837 | 4,132 | 3,418 | 2,777 | 3,473 | 3,351 | 4,025 | 3,789 | 3,362 |
| 2001 | 4,119 | 3,779 | 4,333 | 4,159 | 3,656 | 3,736 | 4,576 | 4,375 | 3,699 | 3,724 | 3,191 | 3,819 |
| 2002 | 4,251 | 3,786 | 3,237 | 3,375 | 5,133 | 5,531 | 5,000 | 4,028 | 3,966 | 3,776 | 4,280 | 4,194 |
| 2003 | 3,777 | 3,184 | 4,854 | 4,679 | 4,314 | 4,489 | 4,432 | 4,878 | 5,063 | 5,434 | 5,227 | 4,866 |
| 2004 | 5,130 | 4,052 | 3,450 | 3,380 | 4,187 | 4,098 | 3,944 | 4,559 | 3,221 | 3,589 | 4,579 | 4,735 |
| 2005 | 4,404 | 3,741 | 4,546 | 3,584 | 3,573 | 3,462 | 4,595 | 3,794 | 4,366 | 3,567 | 5,333 | 4,528 |
| 2006 | 4,156 | 2,840 | 3,840 | 3,529 | 3,216 | 2,853 | 2,377 | 2,553 | 2,588 | 2,099 | 2,312 | 2,091 |
| 2007 | 1,611 | 1,513 | 1,751 | 1,027 | 1,539 | 1,820 | 2,424 | 2,018 | 1,979 | 2,020 | 2,266 | 1,914 |
| 2008 | 1,527 | 942 | 1,795 | 1,535 | 1,950 | 1,593 | 1,915 | 1,998 | 1,684 | 2,136 | 1,530 | 2,505 |
| 2009 | 2,040 | 2,138 | 2,301 | 1,606 | 1,955 | 2,134 | 1,263 | 1,474 | 1,539 | 2,056 | 1,715 | 1,136 |
| 2010 | 840 | 1,262 | 858 | 1,163 | 681 | 1,166 | 1,186 | 1,222 | 1,274 | 752 | 982 | 1,013 |
| 2011 | 635 | 483 | 459 | 743 | 803 | 511 | 916 | 992 | 954 | 612 | 608 | 713 |
| 2012 | 451 | 242 | 423 | 434 | 688 | 235 | 157 | 109 | 153 | 93 | 99 | 74 |
| 2013 | 116 | 117 | 98 | 84 | 90 | 82 | 77 | 127 | 59 | 81 | 67 | 71 |
| 2014 | 113 | 73 | 68 | 485 | 76 | 102 | 83 | 81 | 270 | 325 | 218 | 193 |
| 2015 | 117 | 117 | 127 | 121 | 188 | 80 | 145 | 188 | 239 | 162 | 232 | 112 |
| 2016 | 46 | 233 | 56 | 259 | 133 | 148 | 195 | 177 | 254 | 134 | 50 | 46 |
| 2017 | 134 | 142 | 99 | 221 | 83 | 153 | 56 | 704 | 273 | 29 | 90 | 84 |
| 2018 | 12 | 40 | 9 | 9 | 3 | 3 | 2 | 2 | 77 | 51 | 21 | 99 |
| 2019 | 5 | 5 | 5 | 7 | 7 | 7 | 8 | 9 | 9 | 9 | 12 | 6 |
| 2020 | 6 | 6 | 6 | 1 | ||||||||
| 2021 | 1 | 2 | 3 | |||||||||
| 2022 | 3 | 3 | 1 | 2 | 5 | 3 | 5 | 3 | 2 | 1 | 3 | |
| - = No Data Reported; -- = Not Applicable; NA = Not Available; W = Withheld to avoid disclosure of individual company data. |
| Release Date: 6/28/2024 |
| Next Release Date: 7/31/2024 |