|
Download Data (XLS File) |
|
||||||||
|
||||||||
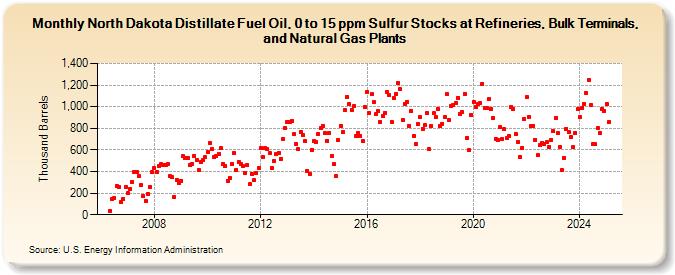
| North Dakota Distillate Fuel Oil, 0 to 15 ppm Sulfur Stocks at Refineries, Bulk Terminals, and Natural Gas Plants (Thousand Barrels) | ||||||||
| Year | Jan | Feb | Mar | Apr | May | Jun | Jul | Aug | Sep | Oct | Nov | Dec |
|---|---|---|---|---|---|---|---|---|---|---|---|---|
| 2006 | 35 | 146 | 158 | 267 | 258 | 121 | 147 | 258 | ||||
| 2007 | 197 | 240 | 306 | 391 | 398 | 360 | 272 | 172 | 130 | 193 | 257 | 391 |
| 2008 | 431 | 393 | 449 | 465 | 461 | 456 | 469 | 354 | 349 | 164 | 324 | 293 |
| 2009 | 315 | 541 | 522 | 524 | 460 | 472 | 547 | 509 | 418 | 487 | 511 | 532 |
| 2010 | 582 | 663 | 608 | 531 | 542 | 561 | 616 | 471 | 450 | 316 | 340 | 470 |
| 2011 | 573 | 416 | 487 | 470 | 452 | 387 | 458 | 280 | 380 | 317 | 386 | 434 |
| 2012 | 613 | 532 | 617 | 606 | 573 | 431 | 501 | 562 | 572 | 520 | 704 | 804 |
| 2013 | 854 | 855 | 872 | 743 | 654 | 604 | 770 | 739 | 683 | 407 | 379 | 602 |
| 2014 | 680 | 674 | 745 | 802 | 825 | 757 | 687 | 755 | 541 | 468 | 358 | 688 |
| 2015 | 822 | 766 | 971 | 1,094 | 1,024 | 972 | 1,003 | 731 | 760 | 729 | 681 | 998 |
| 2016 | 1,138 | 938 | 1,115 | 1,039 | 932 | 957 | 857 | 913 | 946 | 1,140 | 1,104 | 859 |
| 2017 | 1,083 | 1,122 | 1,223 | 1,160 | 881 | 1,027 | 1,048 | 824 | 961 | 731 | 654 | 842 |
| 2018 | 903 | 797 | 827 | 941 | 605 | 819 | 938 | 903 | 977 | 820 | 844 | 902 |
| 2019 | 1,116 | 875 | 1,004 | 1,019 | 1,038 | 1,084 | 936 | 953 | 1,121 | 714 | 597 | 924 |
| 2020 | 1,048 | 999 | 1,021 | 1,035 | 1,214 | 990 | 989 | 1,072 | 977 | 898 | 705 | 693 |
| 2021 | 811 | 703 | 793 | 710 | 732 | 998 | 974 | 748 | 675 | 534 | 620 | 888 |
| 2022 | 1,089 | 908 | 817 | 824 | 694 | 550 | 647 | 666 | 652 | 670 | 630 | 693 |
| 2023 | 771 | 898 | 755 | 630 | 410 | 528 | 797 | 765 | 721 | 624 | 756 | 974 |
| 2024 | 900 | 992 | 1,025 | 1,128 | ||||||||
| - = No Data Reported; -- = Not Applicable; NA = Not Available; W = Withheld to avoid disclosure of individual company data. |
| Release Date: 6/28/2024 |
| Next Release Date: 7/31/2024 |