|
Download Data (XLS File) |
|
||||||||
|
||||||||
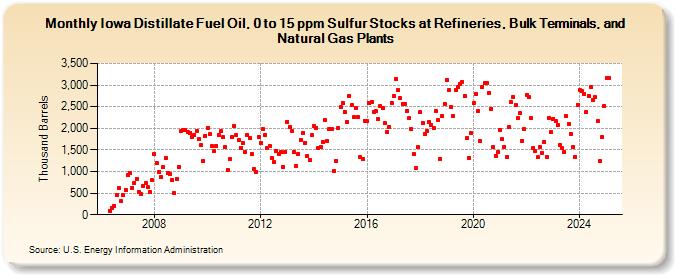
| Iowa Distillate Fuel Oil, 0 to 15 ppm Sulfur Stocks at Refineries, Bulk Terminals, and Natural Gas Plants (Thousand Barrels) | ||||||||
| Year | Jan | Feb | Mar | Apr | May | Jun | Jul | Aug | Sep | Oct | Nov | Dec |
|---|---|---|---|---|---|---|---|---|---|---|---|---|
| 2006 | 95 | 162 | 198 | 447 | 613 | 314 | 447 | 583 | ||||
| 2007 | 910 | 972 | 625 | 737 | 837 | 529 | 473 | 667 | 730 | 640 | 522 | 795 |
| 2008 | 1,403 | 1,193 | 981 | 875 | 1,097 | 1,316 | 959 | 946 | 811 | 495 | 837 | 1,113 |
| 2009 | 1,940 | 1,971 | 1,968 | 1,905 | 1,900 | 1,804 | 1,851 | 1,944 | 1,757 | 1,611 | 1,244 | 1,824 |
| 2010 | 2,008 | 1,862 | 1,587 | 1,464 | 1,592 | 1,842 | 1,927 | 1,792 | 1,562 | 1,039 | 1,280 | 1,787 |
| 2011 | 2,056 | 1,841 | 1,723 | 1,550 | 1,655 | 1,460 | 1,852 | 1,780 | 1,407 | 1,047 | 990 | 1,793 |
| 2012 | 1,664 | 1,979 | 1,854 | 1,550 | 1,585 | 1,318 | 1,227 | 1,486 | 1,400 | 1,455 | 1,106 | 1,460 |
| 2013 | 2,153 | 2,034 | 1,935 | 1,460 | 1,138 | 1,412 | 1,730 | 1,894 | 1,671 | 1,362 | 1,272 | 1,839 |
| 2014 | 2,054 | 2,015 | 1,552 | 1,567 | 1,694 | 2,194 | 1,700 | 1,981 | 1,993 | 1,010 | 1,253 | 2,012 |
| 2015 | 2,486 | 2,592 | 2,376 | 2,151 | 2,758 | 2,533 | 2,257 | 2,473 | 2,265 | 1,325 | 1,288 | 2,176 |
| 2016 | 2,163 | 2,589 | 2,609 | 2,374 | 2,392 | 2,209 | 2,512 | 2,465 | 2,117 | 1,903 | 2,039 | 2,596 |
| 2017 | 2,751 | 3,138 | 2,888 | 2,692 | 2,566 | 2,566 | 2,406 | 2,235 | 1,983 | 1,414 | 1,085 | 1,560 |
| 2018 | 2,368 | 2,128 | 1,871 | 1,934 | 2,138 | 2,072 | 2,007 | 2,405 | 2,187 | 1,298 | 2,288 | 2,572 |
| 2019 | 3,119 | 2,886 | 2,493 | 2,290 | 2,875 | 2,950 | 3,035 | 3,073 | 2,749 | 1,768 | 1,308 | 1,887 |
| 2020 | 2,575 | 2,785 | 2,405 | 1,702 | 2,948 | 3,057 | 3,041 | 2,819 | 2,453 | 1,561 | 1,366 | 1,443 |
| 2021 | 1,967 | 1,752 | 1,578 | 1,347 | 2,019 | 2,600 | 2,733 | 2,540 | 2,236 | 2,345 | 1,717 | 1,979 |
| 2022 | 2,772 | 2,720 | 2,228 | 1,533 | 1,475 | 1,329 | 1,570 | 1,434 | 1,694 | 1,346 | 2,233 | 1,917 |
| 2023 | 2,221 | 2,166 | 2,068 | 1,615 | 1,542 | 1,455 | 2,278 | 2,099 | 1,873 | 1,562 | 1,339 | 2,546 |
| 2024 | 2,876 | 2,857 | 2,795 | 2,383 | ||||||||
| - = No Data Reported; -- = Not Applicable; NA = Not Available; W = Withheld to avoid disclosure of individual company data. |
| Release Date: 6/28/2024 |
| Next Release Date: 7/31/2024 |