|
Download Data (XLS File) |
|
||||||||
|
||||||||
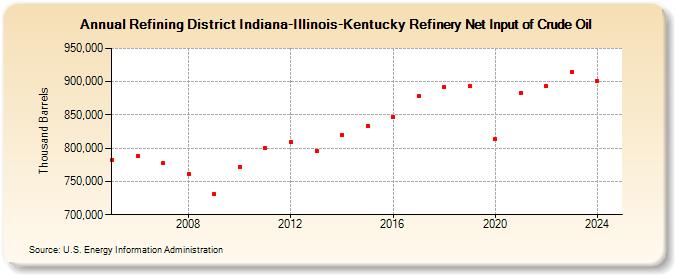
| Refining District Indiana-Illinois-Kentucky Refinery Net Input of Crude Oil (Thousand Barrels) | ||||||||
| Decade | Year-0 | Year-1 | Year-2 | Year-3 | Year-4 | Year-5 | Year-6 | Year-7 | Year-8 | Year-9 |
|---|---|---|---|---|---|---|---|---|---|---|
| 2000's | 782,156 | 788,704 | 777,729 | 760,984 | 731,339 | |||||
| 2010's | 771,921 | 799,702 | 808,927 | 795,962 | 819,971 | 833,934 | 846,547 | 877,925 | 891,941 | 893,503 |
| 2020's | 813,350 | 883,054 | 893,196 | 914,932 |
| - = No Data Reported; -- = Not Applicable; NA = Not Available; W = Withheld to avoid disclosure of individual company data. |
| Release Date: 8/30/2024 |
| Next Release Date: 8/29/2025 |