|
Download Data (XLS File) |
|
||||||||
|
||||||||
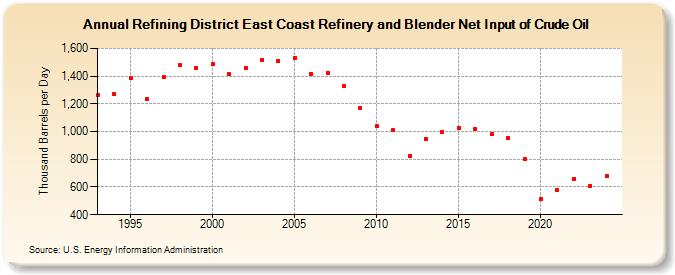
| Refining District East Coast Refinery and Blender Net Input of Crude Oil (Thousand Barrels per Day) | ||||||||
| Decade | Year-0 | Year-1 | Year-2 | Year-3 | Year-4 | Year-5 | Year-6 | Year-7 | Year-8 | Year-9 |
|---|---|---|---|---|---|---|---|---|---|---|
| 1990's | 1,262 | 1,271 | 1,386 | 1,236 | 1,394 | 1,480 | 1,456 | |||
| 2000's | 1,485 | 1,413 | 1,455 | 1,516 | 1,508 | 1,534 | 1,418 | 1,426 | 1,332 | 1,171 |
| 2010's | 1,037 | 1,009 | 827 | 949 | 1,000 | 1,029 | 1,015 | 979 | 955 | 799 |
| 2020's | 511 | 580 | 660 | 609 |
| - = No Data Reported; -- = Not Applicable; NA = Not Available; W = Withheld to avoid disclosure of individual company data. |
| Release Date: 6/28/2024 |
| Next Release Date: 8/30/2024 |