|
Download Data (XLS File) |
|
||||||||
|
||||||||
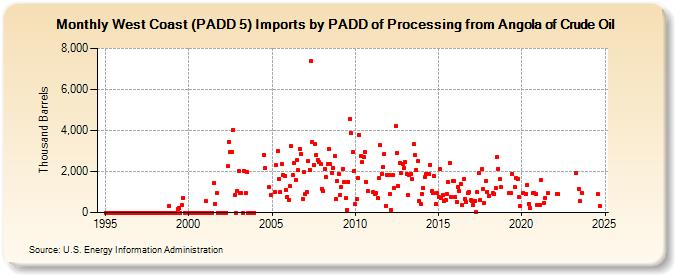
| West Coast (PADD 5) Imports by PADD of Processing from Angola of Crude Oil (Thousand Barrels) | ||||||||
| Year | Jan | Feb | Mar | Apr | May | Jun | Jul | Aug | Sep | Oct | Nov | Dec |
|---|---|---|---|---|---|---|---|---|---|---|---|---|
| 1995 | 0 | 0 | 0 | 0 | 0 | 0 | 0 | 0 | 0 | 0 | 0 | 0 |
| 1996 | 0 | 0 | 0 | 0 | 0 | 0 | 0 | 0 | 0 | 0 | 0 | 0 |
| 1997 | 0 | 0 | 0 | 0 | 0 | 0 | 0 | 0 | 0 | 0 | 0 | 0 |
| 1998 | 0 | 0 | 0 | 0 | 0 | 0 | 0 | 0 | 0 | 0 | 310 | 0 |
| 1999 | 0 | 0 | 0 | 0 | 178 | 199 | 0 | 353 | 713 | 0 | 0 | 0 |
| 2000 | 0 | 0 | 0 | 0 | 0 | 0 | 0 | 0 | 0 | 0 | 0 | 0 |
| 2001 | 560 | 0 | 0 | 0 | 0 | 0 | 1,453 | 436 | 948 | 0 | 0 | 0 |
| 2002 | 0 | 0 | 0 | 0 | 2,245 | 3,441 | 2,972 | 2,969 | 4,037 | 847 | 0 | 1,041 |
| 2003 | 2,001 | 950 | 950 | 0 | 2,026 | 932 | 1,953 | 0 | 0 | 0 | 0 | 0 |
| 2004 | 2,803 | 2,171 | 1,233 | 844 | ||||||||
| 2005 | 1,016 | 2,300 | 2,985 | 1,624 | 999 | 2,390 | 1,806 | 1,786 | 1,119 | 779 | ||
| 2006 | 634 | 1,316 | 3,226 | 1,807 | 2,430 | 1,600 | 2,541 | 2,071 | 3,118 | 2,869 | 672 | 1,953 |
| 2007 | 900 | 991 | 2,510 | 2,097 | 7,378 | 3,437 | 2,307 | 3,325 | 2,795 | 2,578 | 2,445 | 2,380 |
| 2008 | 1,153 | 1,027 | 2,123 | 1,710 | 2,342 | 3,097 | 2,351 | 1,940 | 2,174 | 2,755 | 657 | 1,538 |
| 2009 | 1,892 | 878 | 1,269 | 2,138 | 1,490 | 721 | 135 | 1,508 | 4,582 | 3,867 | 2,948 | 2,002 |
| 2010 | 403 | 648 | 1,669 | 3,774 | 2,753 | 2,449 | 2,730 | 2,937 | 1,496 | 1,045 | ||
| 2011 | 986 | 927 | 949 | 711 | 1,668 | 3,270 | 1,901 | 2,226 | 2,856 | 337 | 1,850 | |
| 2012 | 1,842 | 905 | 115 | 1,831 | 1,212 | 4,195 | 2,908 | 1,303 | 2,407 | 1,904 | 2,352 | 2,163 |
| 2013 | 2,459 | 1,864 | 836 | 1,820 | 1,885 | 1,648 | 3,323 | 2,790 | 2,098 | 2,497 | 548 | 426 |
| 2014 | 906 | 1,186 | 1,719 | 1,875 | 1,886 | 1,876 | 2,335 | 1,038 | 948 | 1,763 | 401 | 941 |
| 2015 | 782 | 2,117 | 709 | 844 | 573 | 588 | 908 | 1,483 | 2,435 | 764 | 1,554 | 1,534 |
| 2016 | 766 | 523 | 1,237 | 1,046 | 1,397 | 362 | 1,649 | 665 | 491 | 962 | 999 | 609 |
| 2017 | 542 | 361 | 569 | 28 | 999 | 1,947 | 603 | 2,116 | 1,147 | 462 | 1,533 | 1,012 |
| 2018 | 810 | 948 | 906 | 1,191 | 2,703 | 2,137 | 1,625 | 1,230 | ||||
| 2019 | 951 | 954 | 1,903 | 1,242 | 1,679 | 1,620 | 759 | 341 | ||||
| 2020 | 951 | 907 | 1,347 | 417 | 222 | 951 | 951 | 909 | 366 | |||
| 2021 | 391 | 1,588 | 484 | 717 | 955 | |||||||
| 2022 | 909 | 899 | ||||||||||
| 2023 | 1,905 | 1,137 | 543 | 950 | ||||||||
| - = No Data Reported; -- = Not Applicable; NA = Not Available; W = Withheld to avoid disclosure of individual company data. |
| Release Date: 3/29/2024 |
| Next Release Date: 4/30/2024 |