|
Download Data (XLS File) |
|
||||||||
|
||||||||
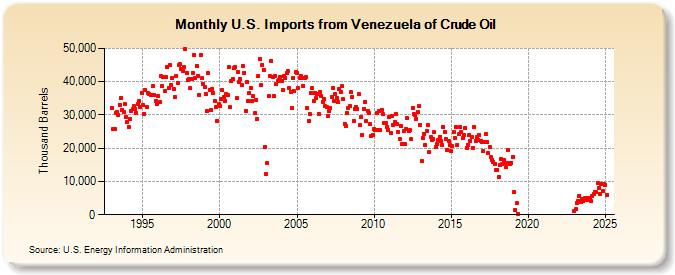
| U.S. Imports from Venezuela of Crude Oil (Thousand Barrels) | ||||||||
| Year | Jan | Feb | Mar | Apr | May | Jun | Jul | Aug | Sep | Oct | Nov | Dec |
|---|---|---|---|---|---|---|---|---|---|---|---|---|
| 1993 | 32,173 | 25,886 | 25,870 | 30,689 | 30,748 | 29,983 | 33,101 | 35,177 | 31,499 | 30,769 | 33,243 | 29,503 |
| 1994 | 27,938 | 26,490 | 28,891 | 31,043 | 31,689 | 32,635 | 31,891 | 30,440 | 33,184 | 34,136 | 32,513 | 36,675 |
| 1995 | 32,890 | 30,337 | 37,457 | 32,491 | 36,446 | 36,258 | 36,015 | 36,026 | 38,646 | 35,927 | 34,212 | 33,291 |
| 1996 | 35,585 | 33,819 | 41,571 | 38,627 | 41,336 | 37,080 | 41,304 | 44,371 | 38,058 | 44,889 | 39,078 | 41,033 |
| 1997 | 37,675 | 35,327 | 41,784 | 39,558 | 44,911 | 45,253 | 43,948 | 43,211 | 44,342 | 49,753 | 42,534 | 40,434 |
| 1998 | 40,900 | 37,988 | 40,707 | 42,704 | 48,019 | 41,227 | 44,794 | 41,816 | 35,975 | 47,990 | 41,017 | 39,415 |
| 1999 | 38,535 | 36,335 | 31,035 | 42,594 | 37,589 | 31,417 | 37,886 | 36,675 | 34,153 | 32,262 | 28,270 | 33,142 |
| 2000 | 32,580 | 34,749 | 37,480 | 35,269 | 34,169 | 36,200 | 35,938 | 44,290 | 32,245 | 40,091 | 40,729 | 43,996 |
| 2001 | 44,376 | 34,987 | 42,916 | 39,979 | 40,673 | 38,904 | 44,805 | 42,608 | 31,219 | 39,926 | 34,320 | 36,530 |
| 2002 | 38,213 | 34,214 | 35,603 | 30,433 | 34,635 | 28,739 | 41,578 | 46,946 | 39,051 | 45,043 | 43,593 | 20,222 |
| 2003 | 12,373 | 15,659 | 35,610 | 41,602 | 46,218 | 41,419 | 35,641 | 41,709 | 39,202 | 40,154 | 40,571 | 41,546 |
| 2004 | 40,249 | 37,512 | 41,640 | 41,171 | 42,513 | 43,164 | 38,079 | 37,012 | 32,112 | 41,229 | 37,096 | 42,754 |
| 2005 | 42,665 | 37,986 | 40,994 | 41,729 | 41,021 | 38,766 | 41,130 | 41,281 | 32,182 | 28,235 | 30,255 | 36,670 |
| 2006 | 38,053 | 34,230 | 36,739 | 35,124 | 36,225 | 30,234 | 36,922 | 35,696 | 33,884 | 34,868 | 32,646 | 32,380 |
| 2007 | 29,619 | 31,230 | 32,127 | 35,461 | 38,180 | 34,061 | 36,174 | 35,221 | 33,802 | 37,852 | 36,814 | 38,639 |
| 2008 | 34,640 | 27,407 | 26,597 | 30,569 | 31,941 | 32,542 | 36,787 | 35,529 | 28,307 | 31,829 | 32,388 | 31,883 |
| 2009 | 36,337 | 26,888 | 29,428 | 24,094 | 31,862 | 34,022 | 28,039 | 31,224 | 30,434 | 27,251 | 23,783 | 23,923 |
| 2010 | 25,646 | 25,555 | 30,505 | 25,521 | 31,327 | 25,512 | 31,508 | 30,198 | 27,566 | 27,488 | 26,514 | 25,586 |
| 2011 | 29,482 | 24,574 | 29,655 | 27,048 | 27,732 | 30,357 | 27,191 | 24,982 | 22,758 | 26,735 | 21,220 | 25,105 |
| 2012 | 21,163 | 25,807 | 29,030 | 25,059 | 25,447 | 22,683 | 32,020 | 30,285 | 30,059 | 28,775 | 30,957 | 32,687 |
| 2013 | 26,995 | 16,207 | 23,016 | 24,340 | 20,886 | 25,135 | 27,003 | 18,707 | 23,323 | 22,340 | 22,762 | 24,745 |
| 2014 | 20,478 | 21,205 | 22,454 | 23,416 | 22,181 | 20,975 | 26,400 | 24,932 | 22,687 | 19,430 | 22,310 | 21,093 |
| 2015 | 19,055 | 20,594 | 24,888 | 23,074 | 26,361 | 21,011 | 24,116 | 26,326 | 24,769 | 23,197 | 23,968 | 26,046 |
| 2016 | 20,146 | 21,043 | 23,973 | 22,237 | 23,298 | 20,193 | 26,373 | 22,173 | 23,327 | 22,435 | 23,918 | 22,250 |
| 2017 | 21,831 | 19,004 | 21,719 | 24,354 | 21,952 | 18,492 | 20,306 | 17,201 | 16,364 | 15,823 | 15,139 | 13,544 |
| 2018 | 13,584 | 11,465 | 14,884 | 16,834 | 15,179 | 16,570 | 15,659 | 14,315 | 19,514 | 15,682 | 15,332 | 15,515 |
| 2019 | 17,403 | 6,772 | 1,454 | 3,429 | 343 | |||||||
| 2023 | 1,241 | 1,630 | 3,383 | 4,210 | 5,727 | 3,774 | 4,739 | 4,509 | 4,884 | 5,140 | 4,423 | 4,998 |
| 2024 | 4,719 | 4,113 | 5,487 | 6,272 | ||||||||
| - = No Data Reported; -- = Not Applicable; NA = Not Available; W = Withheld to avoid disclosure of individual company data. |
| Release Date: 6/28/2024 |
| Next Release Date: 7/31/2024 |