|
Download Data (XLS File) |
|
||||||||
|
||||||||
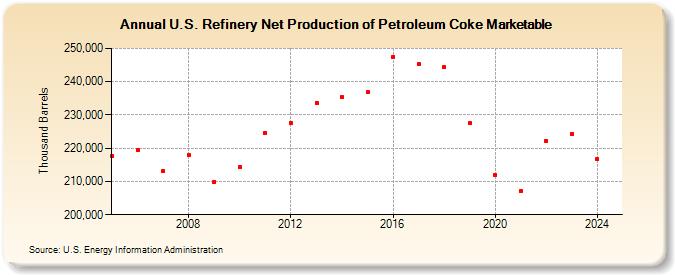
| U.S. Refinery Net Production of Petroleum Coke Marketable (Thousand Barrels) | ||||||||
| Decade | Year-0 | Year-1 | Year-2 | Year-3 | Year-4 | Year-5 | Year-6 | Year-7 | Year-8 | Year-9 |
|---|---|---|---|---|---|---|---|---|---|---|
| 2000's | 217,502 | 219,398 | 213,203 | 217,804 | 209,960 | |||||
| 2010's | 214,313 | 224,525 | 227,694 | 233,658 | 235,454 | 236,805 | 247,525 | 245,213 | 244,392 | 227,503 |
| 2020's | 211,970 | 207,164 | 222,208 | 224,401 |
| - = No Data Reported; -- = Not Applicable; NA = Not Available; W = Withheld to avoid disclosure of individual company data. |
| Release Date: 6/28/2024 |
| Next Release Date: 8/30/2024 |