|
Download Data (XLS File) |
|
||||||||
|
||||||||
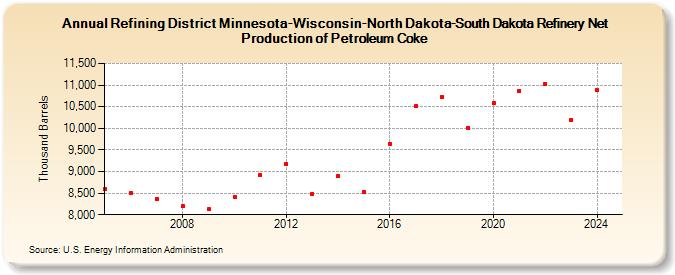
| Refining District Minnesota-Wisconsin-North Dakota-South Dakota Refinery Net Production of Petroleum Coke (Thousand Barrels) | ||||||||
| Decade | Year-0 | Year-1 | Year-2 | Year-3 | Year-4 | Year-5 | Year-6 | Year-7 | Year-8 | Year-9 |
|---|---|---|---|---|---|---|---|---|---|---|
| 2000's | 8,605 | 8,514 | 8,358 | 8,191 | 8,126 | |||||
| 2010's | 8,412 | 8,915 | 9,173 | 8,483 | 8,899 | 8,531 | 9,643 | 10,510 | 10,733 | 10,016 |
| 2020's | 10,578 | 10,872 | 11,034 | 10,199 |
| - = No Data Reported; -- = Not Applicable; NA = Not Available; W = Withheld to avoid disclosure of individual company data. |
| Release Date: 3/29/2024 |
| Next Release Date: 8/30/2024 |