|
Download Data (XLS File) |
|
||||||||
|
||||||||
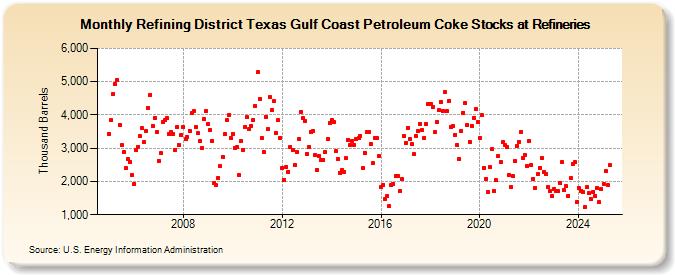
| Refining District Texas Gulf Coast Petroleum Coke Stocks at Refineries (Thousand Barrels) | ||||||||
| Year | Jan | Feb | Mar | Apr | May | Jun | Jul | Aug | Sep | Oct | Nov | Dec |
|---|---|---|---|---|---|---|---|---|---|---|---|---|
| 2005 | 3,419 | 3,847 | 4,626 | 4,928 | 5,055 | 3,691 | 3,082 | 2,877 | 2,408 | 2,670 | 2,593 | 2,183 |
| 2006 | 1,935 | 2,944 | 3,048 | 3,355 | 3,599 | 3,184 | 3,520 | 4,205 | 4,608 | 3,672 | 3,900 | 3,493 |
| 2007 | 2,628 | 2,847 | 3,788 | 3,838 | 3,901 | 3,428 | 3,487 | 3,438 | 2,950 | 3,642 | 3,094 | 3,394 |
| 2008 | 3,649 | 3,269 | 3,343 | 3,528 | 4,063 | 4,104 | 3,625 | 3,443 | 3,213 | 3,008 | 3,870 | 4,111 |
| 2009 | 3,723 | 3,545 | 3,228 | 1,948 | 1,881 | 2,111 | 2,450 | 2,730 | 3,419 | 3,833 | 3,989 | 3,302 |
| 2010 | 3,431 | 3,007 | 3,032 | 2,197 | 3,212 | 2,956 | 3,648 | 3,923 | 3,564 | 3,675 | 3,845 | 4,272 |
| 2011 | 5,277 | 4,493 | 3,321 | 2,893 | 3,947 | 3,570 | 4,539 | 4,145 | 4,409 | 3,461 | 3,840 | 3,320 |
| 2012 | 2,411 | 2,057 | 2,438 | 2,293 | 3,025 | 2,941 | 2,481 | 2,895 | 3,282 | 4,091 | 3,897 | 3,821 |
| 2013 | 2,836 | 3,045 | 3,499 | 3,524 | 2,793 | 2,352 | 2,759 | 2,643 | 2,647 | 2,879 | 3,263 | 3,763 |
| 2014 | 3,849 | 3,795 | 2,902 | 2,668 | 2,269 | 2,352 | 2,287 | 2,695 | 3,259 | 3,097 | 3,216 | 3,110 |
| 2015 | 3,273 | 3,305 | 3,374 | 2,402 | 2,867 | 3,486 | 3,479 | 3,124 | 2,543 | 3,312 | 3,292 | 2,767 |
| 2016 | 1,825 | 1,901 | 1,475 | 1,567 | 1,269 | 1,880 | 1,918 | 2,159 | 2,159 | 1,703 | 2,069 | 3,374 |
| 2017 | 3,169 | 3,621 | 3,264 | 3,124 | 2,816 | 3,366 | 3,512 | 3,735 | 3,546 | 3,318 | 3,732 | 4,335 |
| 2018 | 4,333 | 4,235 | 3,472 | 3,794 | 4,145 | 4,389 | 4,122 | 4,677 | 4,113 | 4,427 | 3,648 | 3,661 |
| 2019 | 3,408 | 3,082 | 2,669 | 3,523 | 4,071 | 4,354 | 3,702 | 3,198 | 3,668 | 3,915 | 4,167 | 3,784 |
| 2020 | 3,318 | 3,983 | 2,413 | 2,086 | 1,668 | 2,437 | 2,981 | 1,710 | 2,035 | 2,757 | 2,588 | 3,171 |
| 2021 | 3,109 | 3,021 | 2,208 | 1,839 | 2,153 | 2,612 | 3,074 | 3,198 | 3,492 | 2,705 | 2,792 | 2,460 |
| 2022 | 3,204 | 2,501 | 2,075 | 1,809 | 2,213 | 2,417 | 2,712 | 2,288 | 2,210 | 1,832 | 1,704 | 1,570 |
| 2023 | 1,776 | 1,721 | 1,703 | 1,944 | 2,587 | 1,739 | 1,854 | 1,576 | 2,096 | 2,537 | 2,570 | 1,378 |
| 2024 | 1,811 | 1,726 | 1,686 | 1,222 | 1,832 | 1,656 | 1,485 | 1,689 | 1,570 | 1,801 | 1,373 | 1,782 |
| 2025 | 1,926 | 2,305 | 1,880 | 2,484 | ||||||||
| - = No Data Reported; -- = Not Applicable; NA = Not Available; W = Withheld to avoid disclosure of individual company data. |
| Release Date: 6/30/2025 |
| Next Release Date: 7/31/2025 |
Referring Pages: