|
Download Data (XLS File) |
|
||||||||
|
||||||||
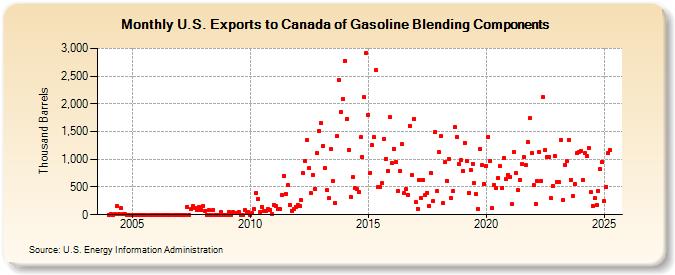
| U.S. Exports to Canada of Gasoline Blending Components (Thousand Barrels) | ||||||||
| Year | Jan | Feb | Mar | Apr | May | Jun | Jul | Aug | Sep | Oct | Nov | Dec |
|---|---|---|---|---|---|---|---|---|---|---|---|---|
| 2004 | 2 | 6 | 2 | 5 | 153 | 10 | 116 | 8 | 4 | 1 | 0 | 1 |
| 2005 | 0 | 0 | 0 | 1 | 3 | 2 | 2 | 2 | 0 | 0 | 0 | |
| 2006 | 0 | 0 | 0 | 0 | 0 | 0 | 0 | 0 | 0 | 0 | ||
| 2007 | 0 | 1 | 1 | 142 | 1 | 95 | 157 | 120 | 82 | 146 | 92 | |
| 2008 | 162 | 75 | 0 | 80 | 1 | 84 | 2 | 2 | 1 | 53 | 0 | 1 |
| 2009 | 0 | 56 | 0 | 41 | 31 | 52 | 2 | 0 | 84 | 44 | 45 | |
| 2010 | 1 | 30 | 103 | 398 | 281 | 49 | 140 | 70 | 65 | 105 | 90 | 4 |
| 2011 | 183 | 155 | 100 | 101 | 357 | 703 | 375 | 538 | 182 | 76 | 103 | 148 |
| 2012 | 183 | 151 | 259 | 747 | 973 | 1,347 | 837 | 384 | 719 | 465 | 1,111 | 1,510 |
| 2013 | 1,650 | 1,247 | 840 | 439 | 294 | 1,177 | 603 | 219 | 1,411 | 2,423 | 1,857 | 2,095 |
| 2014 | 2,776 | 1,733 | 1,166 | 328 | 674 | 485 | 455 | 413 | 1,396 | 1,045 | 2,117 | 2,919 |
| 2015 | 1,806 | 760 | 1,250 | 1,393 | 2,609 | 495 | 507 | 567 | 1,369 | 1,009 | 790 | 1,755 |
| 2016 | 927 | 1,192 | 957 | 432 | 781 | 1,272 | 386 | 455 | 357 | 1,606 | 708 | 1,735 |
| 2017 | 229 | 109 | 628 | 310 | 625 | 351 | 396 | 164 | 749 | 246 | 1,496 | 422 |
| 2018 | 1,123 | 1,419 | 206 | 952 | 616 | 1,013 | 301 | 419 | 1,579 | 1,400 | 916 | 978 |
| 2019 | 783 | 1,299 | 967 | 395 | 809 | 923 | 570 | 369 | 104 | 1,186 | 891 | 556 |
| 2020 | 883 | 1,405 | 977 | 121 | 543 | 473 | 665 | 874 | 490 | 1,024 | 640 | 719 |
| 2021 | 686 | 185 | 1,136 | 745 | 450 | 629 | 916 | 1,042 | 894 | 1,310 | 1,739 | 1,114 |
| 2022 | 527 | 201 | 600 | 1,134 | 605 | 2,121 | 1,166 | 1,047 | 1,044 | 299 | 525 | 1,057 |
| 2023 | 593 | 587 | 1,349 | 266 | 898 | 963 | 1,350 | 628 | 338 | 556 | 1,105 | 1,131 |
| 2024 | 1,158 | 630 | 1,108 | 1,055 | 1,207 | 404 | ||||||
| - = No Data Reported; -- = Not Applicable; NA = Not Available; W = Withheld to avoid disclosure of individual company data. |
| Release Date: 8/30/2024 |
| Next Release Date: 9/30/2024 |