|
Download Data (XLS File) |
|
||||||||
|
||||||||
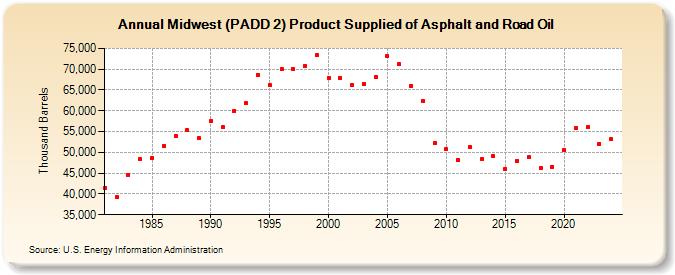
| Midwest (PADD 2) Product Supplied of Asphalt and Road Oil (Thousand Barrels) | ||||||||
| Decade | Year-0 | Year-1 | Year-2 | Year-3 | Year-4 | Year-5 | Year-6 | Year-7 | Year-8 | Year-9 |
|---|---|---|---|---|---|---|---|---|---|---|
| 1980's | 41,442 | 39,244 | 44,626 | 48,299 | 48,694 | 51,602 | 53,957 | 55,292 | 53,331 | |
| 1990's | 57,468 | 55,978 | 60,022 | 61,757 | 68,694 | 66,091 | 69,967 | 69,992 | 70,862 | 73,292 |
| 2000's | 67,955 | 67,896 | 66,263 | 66,387 | 68,088 | 73,124 | 71,188 | 65,962 | 62,331 | 52,200 |
| 2010's | 50,708 | 48,265 | 51,337 | 48,346 | 49,141 | 46,055 | 47,918 | 48,776 | 46,206 | 46,579 |
| 2020's | 50,553 | 55,807 | 56,077 | 52,220 |
| - = No Data Reported; -- = Not Applicable; NA = Not Available; W = Withheld to avoid disclosure of individual company data. |
| Release Date: 6/28/2024 |
| Next Release Date: 8/30/2024 |