|
Download Data (XLS File) |
|
||||||||
|
||||||||
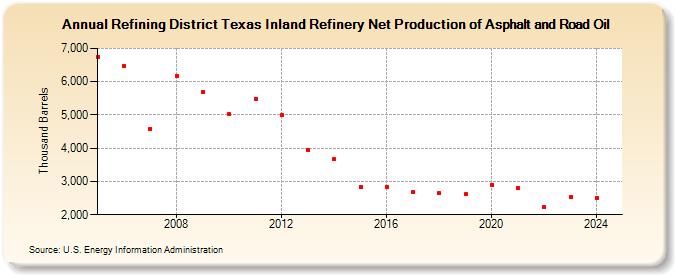
| Refining District Texas Inland Refinery Net Production of Asphalt and Road Oil (Thousand Barrels) | ||||||||
| Decade | Year-0 | Year-1 | Year-2 | Year-3 | Year-4 | Year-5 | Year-6 | Year-7 | Year-8 | Year-9 |
|---|---|---|---|---|---|---|---|---|---|---|
| 2000's | 6,750 | 6,466 | 4,591 | 6,176 | 5,690 | |||||
| 2010's | 5,015 | 5,480 | 4,983 | 3,942 | 3,663 | 2,832 | 2,844 | 2,678 | 2,641 | 2,609 |
| 2020's | 2,900 | 2,802 | 2,221 | 2,527 |
| - = No Data Reported; -- = Not Applicable; NA = Not Available; W = Withheld to avoid disclosure of individual company data. |
| Release Date: 3/29/2024 |
| Next Release Date: 8/30/2024 |