|
Download Data (XLS File) |
|
||||||||
|
||||||||
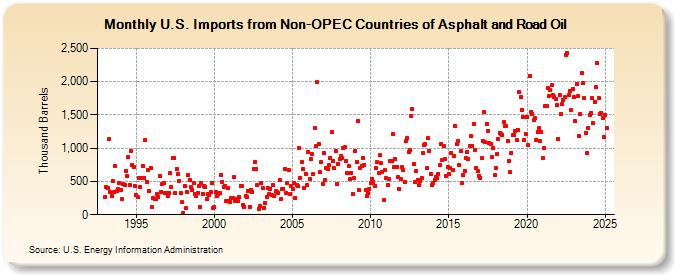
| U.S. Imports from Non-OPEC Countries of Asphalt and Road Oil (Thousand Barrels) | ||||||||
| Year | Jan | Feb | Mar | Apr | May | Jun | Jul | Aug | Sep | Oct | Nov | Dec |
|---|---|---|---|---|---|---|---|---|---|---|---|---|
| 1993 | 272 | 414 | 395 | 1,133 | 338 | 276 | 514 | 342 | 738 | 362 | 380 | 480 |
| 1994 | 376 | 236 | 466 | 448 | 660 | 583 | 861 | 451 | 953 | 751 | 711 | 427 |
| 1995 | 292 | 270 | 557 | 416 | 549 | 736 | 558 | 1,125 | 486 | 679 | 355 | 705 |
| 1996 | 112 | 244 | 234 | 234 | 311 | 268 | 589 | 348 | 469 | 476 | 330 | 332 |
| 1997 | 279 | 324 | 629 | 423 | 850 | 847 | 324 | 692 | 609 | 508 | 324 | 184 |
| 1998 | 25 | 432 | 96 | 341 | 592 | 524 | 420 | 368 | 481 | 316 | 288 | 332 |
| 1999 | 432 | 109 | 480 | 312 | 433 | 424 | 239 | 317 | 297 | 337 | 481 | 102 |
| 2000 | 109 | 343 | 288 | 315 | 323 | 598 | 496 | 415 | 438 | 203 | 405 | 203 |
| 2001 | 196 | 248 | 255 | 560 | 207 | 238 | 200 | 268 | 433 | 433 | 153 | 121 |
| 2002 | 281 | 269 | 350 | 113 | 372 | 345 | 681 | 789 | 691 | 443 | 83 | 130 |
| 2003 | 474 | 400 | 105 | 173 | 271 | 400 | 307 | 393 | 293 | 448 | 274 | 352 |
| 2004 | 345 | 324 | 520 | 239 | 383 | 394 | 694 | 331 | 472 | 670 | 310 | 438 |
| 2005 | 387 | 475 | 255 | 446 | 426 | 999 | 556 | 789 | 693 | 404 | 617 | 444 |
| 2006 | 949 | 543 | 835 | 908 | 611 | 1,309 | 1,029 | 1,989 | 1,069 | 639 | 791 | 469 |
| 2007 | 930 | 526 | 698 | 685 | 740 | 856 | 1,240 | 805 | 695 | 959 | 456 | 765 |
| 2008 | 837 | 886 | 856 | 996 | 1,013 | 813 | 634 | 729 | 531 | 626 | 315 | 554 |
| 2009 | 965 | 794 | 1,407 | 378 | 696 | 735 | 851 | 752 | 368 | 283 | 327 | 387 |
| 2010 | 475 | 544 | 493 | 436 | 695 | 796 | 630 | 892 | 772 | 644 | 217 | 668 |
| 2011 | 549 | 447 | 544 | 808 | 801 | 1,208 | 715 | 838 | 717 | 560 | 389 | 541 |
| 2012 | 712 | 668 | 492 | 1,111 | 1,151 | 944 | 972 | 1,487 | 1,591 | 769 | 491 | 662 |
| 2013 | 527 | 452 | 512 | 551 | 928 | 1,052 | 1,058 | 708 | 1,151 | 952 | 616 | 445 |
| 2014 | 478 | 528 | 569 | 546 | 612 | 740 | 1,063 | 827 | 1,034 | 843 | 582 | 710 |
| 2015 | 616 | 697 | 933 | 679 | 882 | 1,331 | 1,059 | 1,103 | 745 | 961 | 476 | 591 |
| 2016 | 661 | 850 | 942 | 834 | 1,040 | 1,180 | 1,033 | 1,362 | 978 | 708 | 661 | 589 |
| 2017 | 556 | 849 | 1,108 | 1,540 | 1,086 | 1,371 | 1,262 | 1,076 | 1,068 | 871 | 997 | 596 |
| 2018 | 704 | 912 | 1,140 | 1,232 | 1,216 | 1,200 | 1,395 | 1,335 | 1,328 | 1,115 | 805 | 640 |
| 2019 | 931 | 1,192 | 1,203 | 1,251 | 1,128 | 1,267 | 1,841 | 1,770 | 1,574 | 1,466 | 1,130 | 1,216 |
| 2020 | 1,475 | 1,043 | 2,085 | 1,544 | 1,518 | 1,430 | 1,453 | 1,129 | 1,238 | 1,300 | 1,103 | 1,245 |
| 2021 | 856 | 1,000 | 1,629 | 1,630 | 1,906 | 1,791 | 1,875 | 1,955 | 1,797 | 1,771 | 1,744 | 1,655 |
| 2022 | 1,140 | 1,795 | 1,515 | 1,660 | 1,725 | 1,763 | 2,398 | 2,426 | 1,794 | 1,860 | 1,567 | 1,891 |
| 2023 | 1,763 | 1,403 | 1,962 | 1,777 | 1,186 | 1,513 | 2,130 | 1,975 | 1,756 | 1,232 | 921 | 1,299 |
| 2024 | 1,506 | 1,533 | 1,756 | 1,379 | ||||||||
| - = No Data Reported; -- = Not Applicable; NA = Not Available; W = Withheld to avoid disclosure of individual company data. |
| Release Date: 6/28/2024 |
| Next Release Date: 7/31/2024 |