|
Download Data (XLS File) |
|
||||||||
|
||||||||
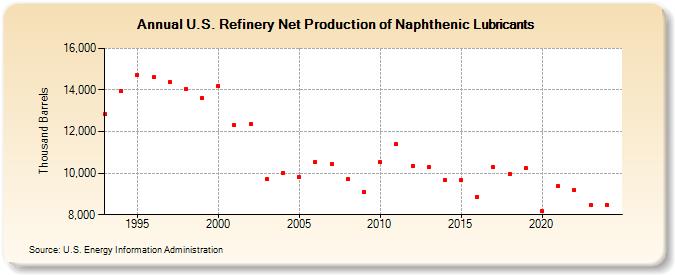
| U.S. Refinery Net Production of Naphthenic Lubricants (Thousand Barrels) | ||||||||
| Decade | Year-0 | Year-1 | Year-2 | Year-3 | Year-4 | Year-5 | Year-6 | Year-7 | Year-8 | Year-9 |
|---|---|---|---|---|---|---|---|---|---|---|
| 1990's | 12,830 | 13,959 | 14,728 | 14,605 | 14,384 | 14,039 | 13,628 | |||
| 2000's | 14,199 | 12,312 | 12,356 | 9,717 | 10,022 | 9,802 | 10,546 | 10,426 | 9,708 | 9,112 |
| 2010's | 10,526 | 11,380 | 10,340 | 10,282 | 9,663 | 9,647 | 8,871 | 10,274 | 9,962 | 10,238 |
| 2020's | 8,161 | 9,377 | 9,200 | 8,454 |
| - = No Data Reported; -- = Not Applicable; NA = Not Available; W = Withheld to avoid disclosure of individual company data. |
| Release Date: 6/28/2024 |
| Next Release Date: 8/30/2024 |