|
Download Data (XLS File) |
|
||||||||
|
||||||||
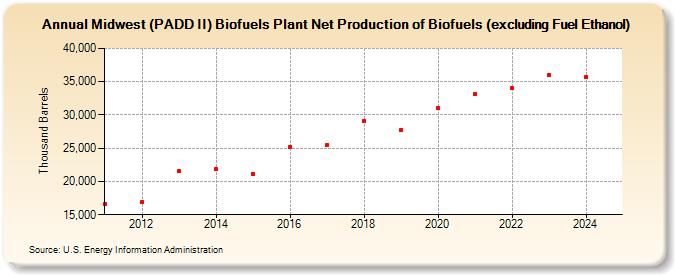
| Midwest (PADD II) Biofuels Plant Net Production of Biofuels (excluding Fuel Ethanol) (Thousand Barrels) | ||||||||
| Decade | Year-0 | Year-1 | Year-2 | Year-3 | Year-4 | Year-5 | Year-6 | Year-7 | Year-8 | Year-9 |
|---|---|---|---|---|---|---|---|---|---|---|
| 2010's | 16,546 | 16,927 | 21,568 | 21,865 | 21,171 | 25,230 | 25,490 | 29,047 | 27,750 | |
| 2020's | 31,026 | 33,085 | 33,991 | 36,098 |
| - = No Data Reported; -- = Not Applicable; NA = Not Available; W = Withheld to avoid disclosure of individual company data. |
| Release Date: 4/30/2024 |
| Next Release Date: 8/30/2024 |