|
Download Data (XLS File) |
|
||||||||
|
||||||||
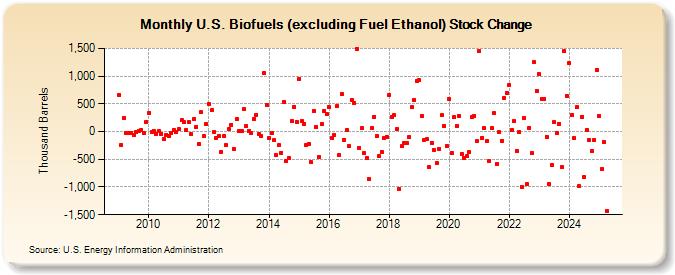
| U.S. Biofuels (excluding Fuel Ethanol) Stock Change (Thousand Barrels) | ||||||||
| Year | Jan | Feb | Mar | Apr | May | Jun | Jul | Aug | Sep | Oct | Nov | Dec |
|---|---|---|---|---|---|---|---|---|---|---|---|---|
| 2009 | 664 | -240 | 241 | -33 | -32 | -19 | -70 | 0 | 16 | 26 | -22 | 180 |
| 2010 | 338 | -10 | 18 | -48 | 7 | -48 | -138 | -59 | -89 | -32 | 26 | -4 |
| 2011 | 39 | 201 | 164 | 27 | 168 | -53 | 224 | 86 | -216 | 347 | -88 | 135 |
| 2012 | 499 | 384 | -1 | -111 | -73 | -362 | -86 | -250 | 47 | 124 | -318 | 219 |
| 2013 | 7 | 3 | 398 | 97 | 10 | -33 | 228 | 306 | -48 | -81 | 1,059 | 477 |
| 2014 | -117 | -24 | -154 | -427 | -246 | -382 | 535 | -534 | -480 | 187 | 448 | 176 |
| 2015 | 954 | 193 | 142 | -238 | -218 | -558 | 374 | 81 | -463 | 136 | 378 | 313 |
| 2016 | 442 | -125 | -58 | 457 | -421 | 676 | -146 | 27 | -267 | 574 | 523 | 1,493 |
| 2017 | -289 | 64 | -388 | -478 | -856 | 61 | 270 | -81 | -446 | -362 | -111 | -90 |
| 2018 | 662 | 271 | 294 | 43 | -1,029 | -263 | -207 | -209 | -98 | 439 | 575 | 916 |
| 2019 | 932 | 282 | -158 | -141 | -647 | -205 | -326 | -564 | -307 | 290 | 104 | -255 |
| 2020 | 585 | -382 | 256 | 107 | 288 | -402 | -471 | -446 | -373 | 264 | 281 | -176 |
| 2021 | 1,449 | -109 | 63 | -176 | -523 | 58 | 328 | -579 | -15 | -163 | 610 | 701 |
| 2022 | 842 | 31 | 194 | -346 | -13 | -993 | 242 | -952 | 73 | -384 | 1,248 | 732 |
| 2023 | 1,031 | 594 | 588 | -97 | -945 | -603 | 165 | -19 | 138 | -641 | 1,450 | 650 |
| 2024 | 1,234 | 306 | -114 | 435 | -991 | 271 | ||||||
| - = No Data Reported; -- = Not Applicable; NA = Not Available; W = Withheld to avoid disclosure of individual company data. |
| Release Date: 8/30/2024 |
| Next Release Date: 9/30/2024 |