|
Download Data (XLS File) |
|
||||||||
|
||||||||
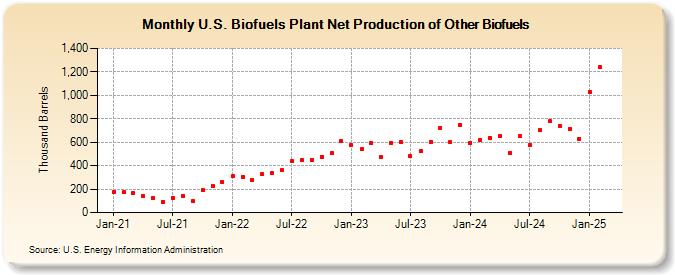
| U.S. Biofuels Plant Net Production of Other Biofuels (Thousand Barrels) | ||||||||
| Year | Jan | Feb | Mar | Apr | May | Jun | Jul | Aug | Sep | Oct | Nov | Dec |
|---|---|---|---|---|---|---|---|---|---|---|---|---|
| 2021 | 179 | 172 | 165 | 140 | 127 | 91 | 125 | 139 | 98 | 191 | 227 | 261 |
| 2022 | 308 | 306 | 279 | 327 | 335 | 365 | 437 | 447 | 448 | 478 | 504 | 607 |
| 2023 | 579 | 539 | 594 | 475 | 592 | 604 | 480 | 521 | 603 | 723 | 599 | 749 |
| 2024 | 597 | 620 | 640 | 651 | 512 | 651 | ||||||
| - = No Data Reported; -- = Not Applicable; NA = Not Available; W = Withheld to avoid disclosure of individual company data. |
| Release Date: 8/30/2024 |
| Next Release Date: 9/30/2024 |
Referring Pages: