|
Download Data (XLS File) |
|
||||||||
|
||||||||
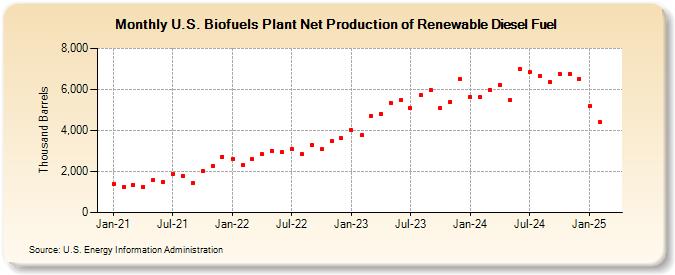
| U.S. Biofuels Plant Net Production of Renewable Diesel Fuel (Thousand Barrels) | ||||||||
| Year | Jan | Feb | Mar | Apr | May | Jun | Jul | Aug | Sep | Oct | Nov | Dec |
|---|---|---|---|---|---|---|---|---|---|---|---|---|
| 2021 | 1,415 | 1,268 | 1,356 | 1,264 | 1,574 | 1,470 | 1,889 | 1,800 | 1,463 | 2,027 | 2,255 | 2,720 |
| 2022 | 2,632 | 2,300 | 2,596 | 2,837 | 3,008 | 2,948 | 3,086 | 2,832 | 3,289 | 3,079 | 3,465 | 3,619 |
| 2023 | 3,994 | 3,752 | 4,740 | 4,789 | 5,377 | 5,482 | 5,086 | 5,798 | 5,968 | 5,018 | 5,321 | 6,420 |
| 2024 | 5,649 | |||||||||||
| - = No Data Reported; -- = Not Applicable; NA = Not Available; W = Withheld to avoid disclosure of individual company data. |
| Release Date: 3/29/2024 |
| Next Release Date: 4/30/2024 |
Referring Pages: