|
Download Data (XLS File) |
|
||||||||
|
||||||||
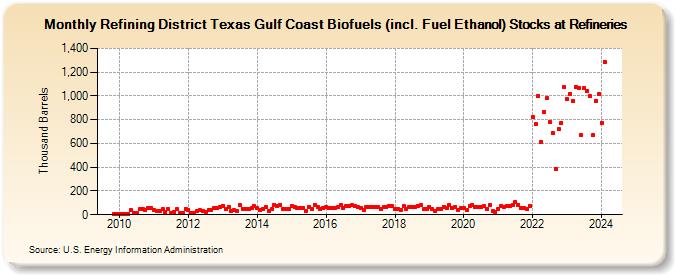
| Refining District Texas Gulf Coast Biofuels (incl. Fuel Ethanol) Stocks at Refineries (Thousand Barrels) | ||||||||
| Year | Jan | Feb | Mar | Apr | May | Jun | Jul | Aug | Sep | Oct | Nov | Dec |
|---|---|---|---|---|---|---|---|---|---|---|---|---|
| 2009 | 8 | 7 | ||||||||||
| 2010 | 7 | 6 | 7 | 8 | 41 | 12 | 18 | 45 | 50 | 38 | 54 | 57 |
| 2011 | 39 | 33 | 32 | 44 | 22 | 46 | 14 | 27 | 45 | 17 | 13 | 49 |
| 2012 | 42 | 13 | 14 | 34 | 37 | 30 | 27 | 39 | 42 | 53 | 56 | 66 |
| 2013 | 77 | 45 | 69 | 29 | 37 | 35 | 79 | 52 | 46 | 51 | 56 | 70 |
| 2014 | 55 | 41 | 52 | 64 | 34 | 46 | 83 | 76 | 83 | 51 | 50 | 49 |
| 2015 | 77 | 66 | 55 | 56 | 57 | 35 | 61 | 52 | 82 | 64 | 49 | 54 |
| 2016 | 69 | 60 | 56 | 54 | 61 | 83 | 60 | 76 | 74 | 78 | 72 | 62 |
| 2017 | 53 | 43 | 61 | 66 | 69 | 65 | 64 | 45 | 62 | 63 | 77 | 75 |
| 2018 | 47 | 50 | 43 | 71 | 52 | 67 | 64 | 67 | 76 | 79 | 44 | 48 |
| 2019 | 66 | 48 | 32 | 50 | 48 | 68 | 54 | 78 | 57 | 66 | 43 | 54 |
| 2020 | 56 | 43 | 75 | 81 | 62 | 61 | 64 | 73 | 52 | 82 | 29 | 24 |
| 2021 | 48 | 73 | 69 | 70 | 76 | 82 | 107 | 84 | 58 | 56 | 49 | 73 |
| 2022 | 822 | 763 | 1,001 | 613 | 867 | 980 | 777 | 684 | 383 | 720 | 772 | 1,075 |
| 2023 | 975 | 1,020 | 956 | 1,075 | 1,066 | 668 | 1,063 | 1,041 | 997 | 668 | 961 | 1,015 |
| 2024 | 773 | 1,286 | 1,120 | 1,146 | 758 | 1,050 | ||||||
| - = No Data Reported; -- = Not Applicable; NA = Not Available; W = Withheld to avoid disclosure of individual company data. |
| Release Date: 8/30/2024 |
| Next Release Date: 9/30/2024 |