|
Download Data (XLS File) |
|
||||||||
|
||||||||
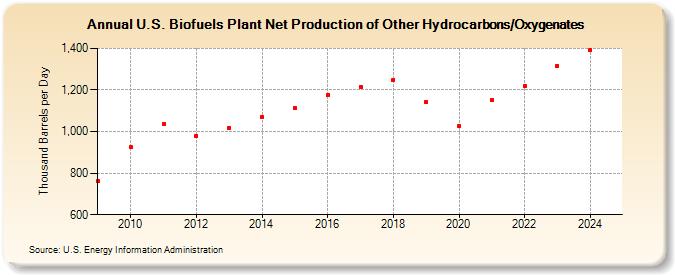
| U.S. Biofuels Plant Net Production of Other Hydrocarbons/Oxygenates (Thousand Barrels per Day) | ||||||||
| Decade | Year-0 | Year-1 | Year-2 | Year-3 | Year-4 | Year-5 | Year-6 | Year-7 | Year-8 | Year-9 |
|---|---|---|---|---|---|---|---|---|---|---|
| 2000's | 762 | |||||||||
| 2010's | 924 | 1,034 | 981 | 1,019 | 1,072 | 1,113 | 1,177 | 1,216 | 1,250 | 1,142 |
| 2020's | 1,025 | 1,152 | 1,219 | 1,318 |
| - = No Data Reported; -- = Not Applicable; NA = Not Available; W = Withheld to avoid disclosure of individual company data. |
| Release Date: 4/30/2024 |
| Next Release Date: 8/30/2024 |