|
Download Data (XLS File) |


|
||||||||
|
||||||||
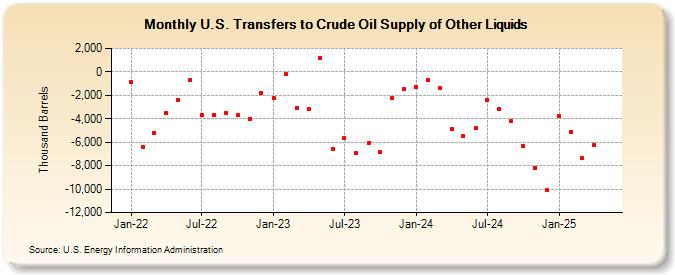
| U.S. Transfers to Crude Oil Supply of Other Liquids (Thousand Barrels) | ||||||||
| Year | Jan | Feb | Mar | Apr | May | Jun | Jul | Aug | Sep | Oct | Nov | Dec |
|---|---|---|---|---|---|---|---|---|---|---|---|---|
| 2022 | -897 | -6,377 | -5,226 | -3,520 | -2,359 | -716 | -3,693 | -3,719 | -3,514 | -3,705 | -3,998 | -1,771 |
| 2023 | -2,253 | -203 | -3,114 | -3,200 | 1,221 | -6,561 | -5,643 | -6,940 | -6,084 | -6,854 | -2,244 | -1,452 |
| 2024 | -1,421 | 455 | -1,806 | -4,302 | -3,514 | -3,847 | -1,977 | -2,176 | -5,614 | -5,337 | -7,911 | -10,051 |
| 2025 | 3,319 | 830 | -2,182 | -41 | -2,548 | 5,613 | 54 | 57 | -2,894 | -4,090 | 3,502 | -3,421 |
| 2026 | -5,915 | -3,390 | 2,176 | 5,826 | -11,276 | 1,028 | -3,063 | |||||
| - = No Data Reported; -- = Not Applicable; NA = Not Available; W = Withheld to avoid disclosure of individual company data. |
| Release Date: 9/30/2026 |
| Next Release Date: 10/30/2026 |
Referring Pages: