|
Download Data (XLS File) |
|
||||||||
|
||||||||
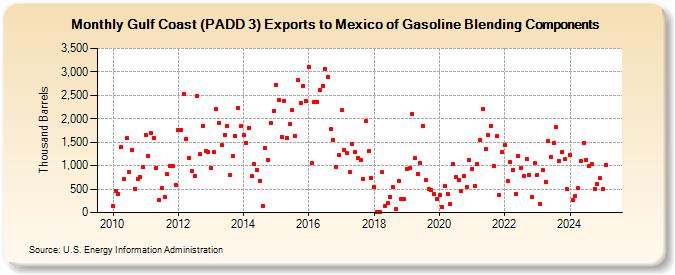
| Gulf Coast (PADD 3) Exports to Mexico of Gasoline Blending Components (Thousand Barrels) | ||||||||
| Year | Jan | Feb | Mar | Apr | May | Jun | Jul | Aug | Sep | Oct | Nov | Dec |
|---|---|---|---|---|---|---|---|---|---|---|---|---|
| 2010 | 133 | 452 | 403 | 1,399 | 721 | 1,580 | 868 | 1,333 | 500 | 712 | 754 | 963 |
| 2011 | 1,662 | 1,197 | 1,695 | 1,597 | 958 | 261 | 531 | 339 | 817 | 991 | 986 | 596 |
| 2012 | 1,755 | 1,755 | 2,527 | 1,573 | 1,153 | 885 | 769 | 2,483 | 1,239 | 1,846 | 1,320 | 1,292 |
| 2013 | 948 | 1,296 | 2,202 | 1,910 | 1,434 | 1,663 | 1,838 | 793 | 1,196 | 1,625 | 2,230 | 1,841 |
| 2014 | 1,656 | 1,486 | 1,812 | 772 | 1,027 | 918 | 679 | 141 | 1,377 | 1,129 | 1,902 | 2,169 |
| 2015 | 2,722 | 2,401 | 1,617 | 2,378 | 1,591 | 1,878 | 2,181 | 1,638 | 2,817 | 2,341 | 2,700 | 2,385 |
| 2016 | 3,094 | 1,059 | 2,348 | 2,366 | 2,610 | 2,706 | 3,067 | 2,893 | 1,774 | 1,551 | 966 | 1,219 |
| 2017 | 2,195 | 1,342 | 1,263 | 860 | 1,455 | 1,288 | 1,155 | 1,122 | 716 | 1,947 | 1,315 | 730 |
| 2018 | 535 | 14 | 11 | 859 | 131 | 197 | 339 | 548 | 69 | 673 | 281 | 279 |
| 2019 | 936 | 945 | 2,106 | 1,154 | 829 | 1,057 | 1,856 | 700 | 495 | 476 | 389 | 290 |
| 2020 | 373 | 118 | 568 | 397 | 193 | 1,038 | 750 | 704 | 459 | 772 | 552 | 1,110 |
| 2021 | 937 | 558 | 1,044 | 1,548 | 2,198 | 1,349 | 1,644 | 1,846 | 997 | 1,627 | 366 | 1,293 |
| 2022 | 1,432 | 667 | 1,071 | 915 | 395 | 1,203 | 942 | 769 | 1,138 | 810 | 324 | 1,054 |
| 2023 | 724 | 136 | 849 | 503 | 1,430 | 1,171 | 1,455 | 1,817 | 1,106 | 1,279 | 1,140 | 481 |
| 2024 | 1,225 | 266 | 348 | 516 | ||||||||
| - = No Data Reported; -- = Not Applicable; NA = Not Available; W = Withheld to avoid disclosure of individual company data. |
| Release Date: 6/28/2024 |
| Next Release Date: 7/31/2024 |