|
Download Data (XLS File) |
|
||||||||
|
||||||||
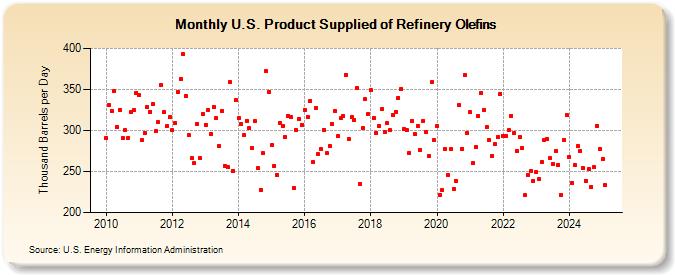
| U.S. Product Supplied of Refinery Olefins (Thousand Barrels per Day) | ||||||||
| Year | Jan | Feb | Mar | Apr | May | Jun | Jul | Aug | Sep | Oct | Nov | Dec |
|---|---|---|---|---|---|---|---|---|---|---|---|---|
| 2010 | 291 | 331 | 324 | 348 | 304 | 325 | 291 | 300 | 291 | 322 | 325 | 346 |
| 2011 | 343 | 288 | 297 | 328 | 323 | 332 | 299 | 310 | 355 | 322 | 305 | 316 |
| 2012 | 300 | 309 | 347 | 363 | 393 | 342 | 294 | 266 | 260 | 308 | 266 | 320 |
| 2013 | 307 | 325 | 296 | 329 | 315 | 281 | 324 | 257 | 255 | 359 | 251 | 337 |
| 2014 | 315 | 308 | 294 | 312 | 303 | 279 | 311 | 254 | 228 | 272 | 372 | 347 |
| 2015 | 282 | 257 | 246 | 309 | 305 | 292 | 318 | 317 | 230 | 300 | 314 | 307 |
| 2016 | 325 | 317 | 336 | 261 | 327 | 271 | 277 | 301 | 272 | 281 | 308 | 324 |
| 2017 | 293 | 315 | 318 | 368 | 290 | 316 | 313 | 352 | 235 | 303 | 338 | 320 |
| 2018 | 349 | 315 | 297 | 306 | 326 | 298 | 309 | 300 | 319 | 323 | 340 | 351 |
| 2019 | 302 | 300 | 273 | 312 | 296 | 306 | 276 | 312 | 298 | 269 | 359 | 288 |
| 2020 | 305 | 222 | 227 | 277 | 246 | 277 | 229 | 239 | 331 | 278 | 367 | 297 |
| 2021 | 322 | 260 | 280 | 318 | 346 | 325 | 304 | 288 | 269 | 283 | 292 | 345 |
| 2022 | 293 | 293 | 300 | 318 | 297 | 275 | 292 | 279 | 221 | 246 | 251 | 239 |
| 2023 | 249 | 241 | 262 | 289 | 290 | 266 | 259 | 275 | 258 | 222 | 288 | 319 |
| 2024 | 268 | 236 | 258 | 281 | 275 | 254 | ||||||
| - = No Data Reported; -- = Not Applicable; NA = Not Available; W = Withheld to avoid disclosure of individual company data. |
| Release Date: 8/30/2024 |
| Next Release Date: 9/30/2024 |