|
Download Data (XLS File) |
|
||||||||
|
||||||||
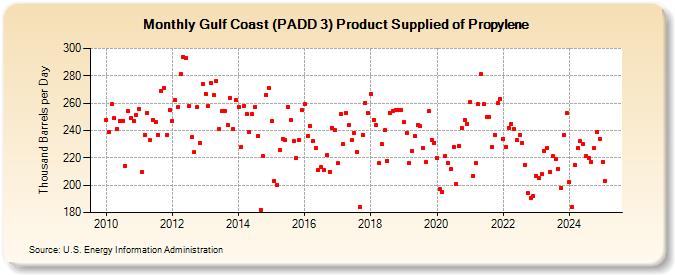
| Gulf Coast (PADD 3) Product Supplied of Propylene (Thousand Barrels per Day) | ||||||||
| Year | Jan | Feb | Mar | Apr | May | Jun | Jul | Aug | Sep | Oct | Nov | Dec |
|---|---|---|---|---|---|---|---|---|---|---|---|---|
| 2010 | 248 | 239 | 259 | 249 | 241 | 247 | 247 | 214 | 254 | 249 | 247 | 251 |
| 2011 | 256 | 210 | 237 | 253 | 233 | 248 | 246 | 237 | 269 | 271 | 237 | 255 |
| 2012 | 247 | 262 | 257 | 281 | 294 | 293 | 258 | 235 | 224 | 257 | 231 | 274 |
| 2013 | 267 | 258 | 275 | 266 | 276 | 241 | 254 | 254 | 244 | 264 | 241 | 262 |
| 2014 | 257 | 228 | 258 | 252 | 239 | 252 | 257 | 236 | 182 | 221 | 266 | 271 |
| 2015 | 247 | 203 | 200 | 226 | 234 | 233 | 257 | 248 | 232 | 220 | 233 | 255 |
| 2016 | 259 | 236 | 243 | 232 | 227 | 211 | 213 | 211 | 222 | 210 | 242 | 240 |
| 2017 | 216 | 252 | 230 | 253 | 244 | 233 | 238 | 224 | 184 | 237 | 260 | 253 |
| 2018 | 267 | 248 | 244 | 216 | 230 | 240 | 218 | 253 | 254 | 255 | 255 | 255 |
| 2019 | 246 | 238 | 216 | 225 | 236 | 244 | 243 | 227 | 217 | 254 | 233 | 231 |
| 2020 | 220 | 197 | 195 | 221 | 216 | 212 | 228 | 201 | 229 | 242 | 248 | 245 |
| 2021 | 261 | 207 | 216 | 259 | 281 | 259 | 250 | 250 | 228 | 237 | 260 | 263 |
| 2022 | 234 | 228 | 242 | 245 | 241 | 233 | 237 | 231 | 215 | 194 | 191 | 192 |
| 2023 | 207 | 205 | 208 | 225 | 227 | 210 | 221 | 219 | 212 | 198 | 237 | 253 |
| 2024 | 202 | 184 | 215 | 227 | 232 | 230 | 221 | 220 | 217 | 227 | 239 | 234 |
| 2025 | 217 | 203 | 188 | 215 | ||||||||
| - = No Data Reported; -- = Not Applicable; NA = Not Available; W = Withheld to avoid disclosure of individual company data. |
| Release Date: 6/30/2025 |
| Next Release Date: 7/31/2025 |