|
Download Data (XLS File) |
|
||||||||
|
||||||||
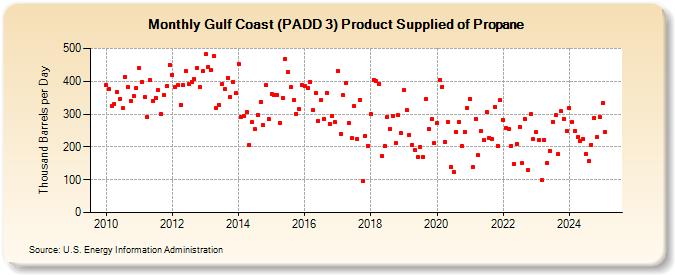
| Gulf Coast (PADD 3) Product Supplied of Propane (Thousand Barrels per Day) | ||||||||
| Year | Jan | Feb | Mar | Apr | May | Jun | Jul | Aug | Sep | Oct | Nov | Dec |
|---|---|---|---|---|---|---|---|---|---|---|---|---|
| 2010 | 389 | 375 | 324 | 331 | 367 | 347 | 317 | 414 | 382 | 340 | 354 | 378 |
| 2011 | 439 | 399 | 352 | 291 | 403 | 341 | 350 | 372 | 300 | 357 | 385 | 450 |
| 2012 | 419 | 382 | 387 | 329 | 387 | 431 | 391 | 398 | 407 | 441 | 383 | 430 |
| 2013 | 482 | 443 | 433 | 476 | 317 | 329 | 391 | 375 | 411 | 353 | 398 | 364 |
| 2014 | 453 | 292 | 295 | 306 | 207 | 275 | 253 | 297 | 336 | 266 | 387 | 284 |
| 2015 | 362 | 357 | 359 | 274 | 349 | 469 | 427 | 382 | 344 | 301 | 314 | 388 |
| 2016 | 386 | 379 | 399 | 311 | 364 | 279 | 342 | 286 | 365 | 271 | 294 | 275 |
| 2017 | 432 | 240 | 357 | 394 | 274 | 227 | 325 | 224 | 344 | 95 | 234 | 203 |
| 2018 | 299 | 405 | 400 | 392 | 173 | 202 | 292 | 256 | 295 | 211 | 296 | 242 |
| 2019 | 373 | 312 | 237 | 206 | 190 | 169 | 200 | 168 | 346 | 255 | 284 | 211 |
| 2020 | 272 | 404 | 383 | 216 | 276 | 139 | 124 | 245 | 277 | 203 | 246 | 319 |
| 2021 | 346 | 138 | 286 | 174 | 249 | 222 | 306 | 228 | 225 | 323 | 204 | 342 |
| 2022 | 282 | 257 | 256 | 203 | 149 | 210 | 262 | 150 | 285 | 130 | 299 | 223 |
| 2023 | 193 | 204 | 157 | 270 | 183 | 241 | 273 | 296 | 193 | 333 | 258 | 209 |
| 2024 | 321 | |||||||||||
| - = No Data Reported; -- = Not Applicable; NA = Not Available; W = Withheld to avoid disclosure of individual company data. |
| Release Date: 3/29/2024 |
| Next Release Date: 4/30/2024 |