|
Download Data (XLS File) |
|
||||||||
|
||||||||
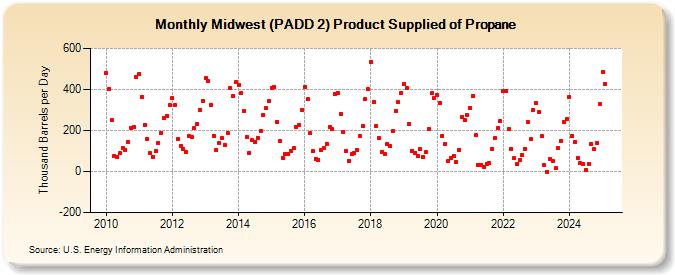
| Midwest (PADD 2) Product Supplied of Propane (Thousand Barrels per Day) | ||||||||
| Year | Jan | Feb | Mar | Apr | May | Jun | Jul | Aug | Sep | Oct | Nov | Dec |
|---|---|---|---|---|---|---|---|---|---|---|---|---|
| 2010 | 481 | 404 | 252 | 74 | 73 | 89 | 116 | 107 | 144 | 212 | 217 | 460 |
| 2011 | 476 | 365 | 229 | 160 | 89 | 72 | 98 | 138 | 189 | 259 | 272 | 324 |
| 2012 | 359 | 325 | 158 | 125 | 109 | 97 | 174 | 168 | 210 | 233 | 300 | 346 |
| 2013 | 454 | 440 | 326 | 175 | 104 | 139 | 162 | 131 | 186 | 408 | 369 | 434 |
| 2014 | 421 | 382 | 297 | 170 | 91 | 153 | 146 | 165 | 198 | 277 | 308 | 343 |
| 2015 | 409 | 413 | 243 | 150 | 66 | 83 | 84 | 99 | 113 | 217 | 225 | 300 |
| 2016 | 414 | 353 | 186 | 99 | 61 | 58 | 106 | 114 | 136 | 216 | 207 | 380 |
| 2017 | 383 | 281 | 195 | 100 | 53 | 84 | 92 | 106 | 171 | 220 | 353 | 400 |
| 2018 | 534 | 340 | 220 | 161 | 97 | 83 | 134 | 124 | 198 | 295 | 337 | 385 |
| 2019 | 427 | 406 | 233 | 102 | 92 | 74 | 108 | 73 | 94 | 206 | 381 | 356 |
| 2020 | 373 | 334 | 175 | 133 | 50 | 67 | 75 | 47 | 107 | 267 | 251 | 273 |
| 2021 | 311 | 370 | 178 | 33 | 33 | 24 | 38 | 40 | 110 | 162 | 210 | 244 |
| 2022 | 390 | 394 | 207 | 109 | 65 | 37 | 55 | 81 | 112 | 243 | 158 | 302 |
| 2023 | 332 | 292 | 171 | 30 | -1 | 60 | 53 | 15 | 113 | 151 | 243 | 255 |
| 2024 | 363 | 175 | 144 | 66 | 40 | 36 | 8 | 39 | 132 | 111 | 141 | 327 |
| 2025 | 485 | 426 | 127 | 25 | ||||||||
| - = No Data Reported; -- = Not Applicable; NA = Not Available; W = Withheld to avoid disclosure of individual company data. |
| Release Date: 6/30/2025 |
| Next Release Date: 7/31/2025 |