|
Download Data (XLS File) |
|
||||||||
|
||||||||
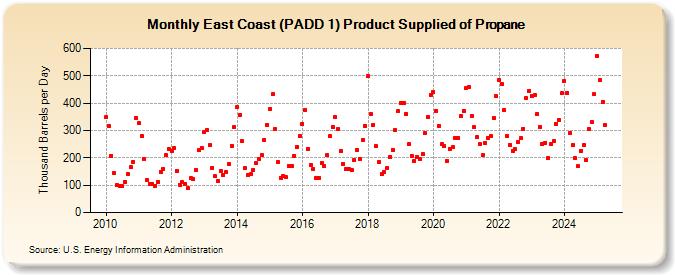
| East Coast (PADD 1) Product Supplied of Propane (Thousand Barrels per Day) | ||||||||
| Year | Jan | Feb | Mar | Apr | May | Jun | Jul | Aug | Sep | Oct | Nov | Dec |
|---|---|---|---|---|---|---|---|---|---|---|---|---|
| 2010 | 348 | 318 | 208 | 144 | 99 | 96 | 96 | 113 | 140 | 166 | 186 | 347 |
| 2011 | 327 | 280 | 197 | 119 | 104 | 104 | 98 | 113 | 149 | 160 | 209 | 231 |
| 2012 | 224 | 236 | 153 | 102 | 110 | 106 | 88 | 125 | 121 | 157 | 227 | 237 |
| 2013 | 294 | 301 | 246 | 164 | 132 | 117 | 151 | 137 | 148 | 177 | 245 | 311 |
| 2014 | 384 | 358 | 261 | 162 | 136 | 140 | 155 | 180 | 197 | 209 | 266 | 321 |
| 2015 | 379 | 432 | 304 | 185 | 128 | 134 | 129 | 171 | 169 | 208 | 241 | 279 |
| 2016 | 325 | 374 | 234 | 173 | 158 | 126 | 128 | 182 | 169 | 209 | 278 | 312 |
| 2017 | 348 | 305 | 225 | 179 | 161 | 160 | 156 | 192 | 229 | 196 | 267 | 317 |
| 2018 | 499 | 359 | 321 | 242 | 183 | 140 | 148 | 164 | 204 | 229 | 301 | 370 |
| 2019 | 401 | 402 | 362 | 249 | 207 | 189 | 203 | 196 | 214 | 290 | 350 | 430 |
| 2020 | 439 | 371 | 318 | 249 | 243 | 189 | 233 | 238 | 274 | 274 | 352 | 372 |
| 2021 | 454 | 460 | 354 | 311 | 275 | 250 | 209 | 256 | 274 | 279 | 346 | 425 |
| 2022 | 486 | 470 | 374 | 281 | 248 | 226 | 231 | 259 | 271 | 307 | 417 | 446 |
| 2023 | 424 | 427 | 312 | 272 | 256 | 274 | 173 | 266 | 252 | 324 | 339 | 380 |
| 2024 | 480 | 438 | 288 | 240 | ||||||||
| - = No Data Reported; -- = Not Applicable; NA = Not Available; W = Withheld to avoid disclosure of individual company data. |
| Release Date: 6/28/2024 |
| Next Release Date: 7/31/2024 |