|
Download Data (XLS File) |
|
||||||||
|
||||||||
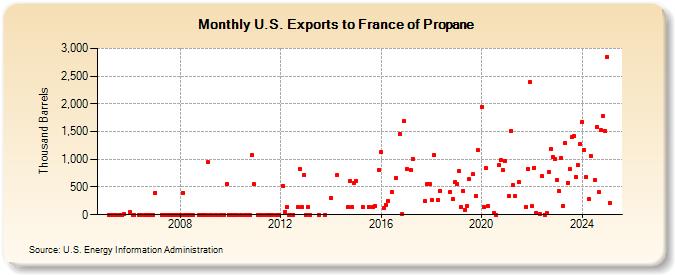
| U.S. Exports to France of Propane (Thousand Barrels) | ||||||||
| Year | Jan | Feb | Mar | Apr | May | Jun | Jul | Aug | Sep | Oct | Nov | Dec |
|---|---|---|---|---|---|---|---|---|---|---|---|---|
| 2005 | 0 | 0 | 0 | 0 | 0 | 0 | 16 | |||||
| 2006 | 41 | 0 | 0 | 0 | 0 | 0 | 0 | 0 | 0 | 0 | ||
| 2007 | 400 | 0 | 0 | 0 | 0 | 0 | 0 | 0 | 0 | 0 | ||
| 2008 | 0 | 400 | 0 | 0 | 0 | 0 | 0 | 0 | 0 | 1 | ||
| 2009 | 0 | 949 | 0 | 1 | 0 | 0 | 0 | 0 | 545 | 0 | ||
| 2010 | 0 | 0 | 0 | 0 | 0 | 0 | 0 | 0 | 1,075 | 550 | ||
| 2011 | 1 | 0 | 0 | 0 | 0 | 0 | 0 | 0 | 0 | |||
| 2012 | 525 | 57 | 148 | 0 | 0 | 1 | 141 | 829 | 141 | 716 | ||
| 2013 | 0 | 142 | 0 | 0 | 0 | |||||||
| 2014 | 297 | 712 | 143 | 607 | 139 | 577 | ||||||
| 2015 | 611 | 145 | 140 | 140 | 158 | 802 | ||||||
| 2016 | 1,131 | 123 | 177 | 246 | 409 | 669 | 1,459 | 18 | 1,688 | |||
| 2017 | 824 | 812 | 1,013 | 245 | 550 | 550 | ||||||
| 2018 | 262 | 1,073 | 267 | 433 | 415 | 280 | 582 | |||||
| 2019 | 550 | 789 | 144 | 430 | 91 | 150 | 642 | 729 | 338 | 1,162 | ||
| 2020 | 1,944 | 137 | 842 | 154 | 32 | 0 | 889 | 979 | 804 | 968 | ||
| 2021 | 335 | 1,510 | 532 | 332 | 584 | 145 | 833 | 2,394 | ||||
| 2022 | 150 | 848 | 36 | 12 | 697 | 0 | 22 | 775 | 1,180 | 1,037 | 1,009 | |
| 2023 | 635 | 423 | 753 | 159 | 713 | 580 | 829 | 1,500 | 1,413 | 987 | 280 | 1,274 |
| 2024 | 1,675 | |||||||||||
| - = No Data Reported; -- = Not Applicable; NA = Not Available; W = Withheld to avoid disclosure of individual company data. |
| Release Date: 3/29/2024 |
| Next Release Date: 4/30/2024 |