|
Download Data (XLS File) |
|
||||||||
|
||||||||
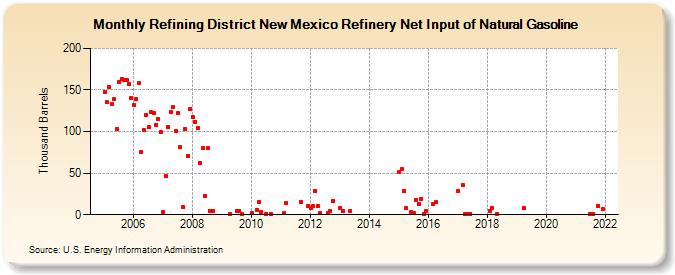
| Refining District New Mexico Refinery Net Input of Natural Gasoline (Thousand Barrels) | ||||||||
| Year | Jan | Feb | Mar | Apr | May | Jun | Jul | Aug | Sep | Oct | Nov | Dec |
|---|---|---|---|---|---|---|---|---|---|---|---|---|
| 2005 | 148 | 135 | 154 | 133 | 139 | 103 | 159 | 163 | 162 | 162 | 157 | 140 |
| 2006 | 132 | 139 | 158 | 75 | 102 | 120 | 105 | 123 | 122 | 108 | 115 | 99 |
| 2007 | 3 | 46 | 105 | 123 | 129 | 101 | 122 | 81 | 9 | 103 | 71 | 127 |
| 2008 | 117 | 112 | 104 | 62 | 80 | 23 | 80 | 5 | 4 | |||
| 2009 | 1 | 4 | 4 | 1 | ||||||||
| 2010 | 2 | 6 | 15 | 3 | 1 | 1 | ||||||
| 2011 | 2 | 14 | 15 | 10 | ||||||||
| 2012 | 8 | 10 | 29 | 11 | 2 | 2 | 4 | 17 | ||||
| 2013 | 8 | 4 | 5 | |||||||||
| 2015 | 51 | 55 | 29 | 8 | 3 | 2 | 18 | 13 | 19 | 1 | 5 | |
| 2016 | 13 | 15 | ||||||||||
| 2017 | 29 | 36 | 1 | 1 | 1 | |||||||
| 2018 | 4 | 8 | 1 | |||||||||
| 2019 | 8 | |||||||||||
| 2021 | 1 | 1 | 11 | 7 | ||||||||
| - = No Data Reported; -- = Not Applicable; NA = Not Available; W = Withheld to avoid disclosure of individual company data. |
| Release Date: 8/30/2024 |
| Next Release Date: 9/30/2024 |
Referring Pages: