|
Download Data (XLS File) |
|
||||||||
|
||||||||
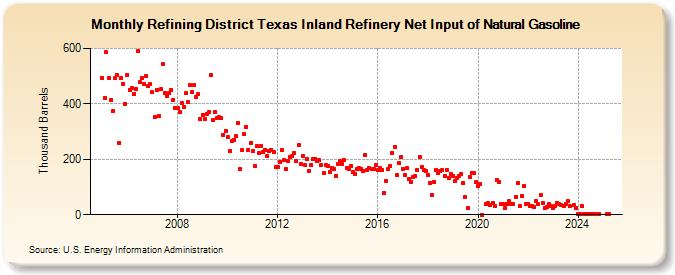
| Refining District Texas Inland Refinery Net Input of Natural Gasoline (Thousand Barrels) | ||||||||
| Year | Jan | Feb | Mar | Apr | May | Jun | Jul | Aug | Sep | Oct | Nov | Dec |
|---|---|---|---|---|---|---|---|---|---|---|---|---|
| 2005 | 494 | 421 | 586 | 493 | 415 | 373 | 493 | 504 | 260 | 494 | 473 | 401 |
| 2006 | 503 | 450 | 456 | 437 | 452 | 589 | 478 | 494 | 473 | 499 | 465 | 470 |
| 2007 | 441 | 352 | 450 | 355 | 453 | 542 | 438 | 427 | 438 | 449 | 413 | 384 |
| 2008 | 385 | 370 | 403 | 389 | 439 | 406 | 467 | 442 | 467 | 423 | 435 | 345 |
| 2009 | 359 | 344 | 364 | 369 | 504 | 341 | 369 | 350 | 351 | 348 | 289 | 302 |
| 2010 | 280 | 229 | 265 | 270 | 283 | 331 | 165 | 232 | 290 | 316 | 235 | 259 |
| 2011 | 229 | 175 | 247 | 222 | 248 | 226 | 235 | 212 | 231 | 234 | 225 | 172 |
| 2012 | 173 | 191 | 234 | 197 | 164 | 192 | 209 | 211 | 222 | 193 | 250 | 183 |
| 2013 | 213 | 179 | 200 | 159 | 179 | 200 | 202 | 193 | 198 | 179 | 149 | 178 |
| 2014 | 174 | 153 | 168 | 164 | 141 | 183 | 194 | 183 | 196 | 169 | 164 | 174 |
| 2015 | 154 | 148 | 164 | 167 | 166 | 156 | 217 | 163 | 167 | 166 | 166 | 180 |
| 2016 | 160 | 169 | 163 | 78 | 122 | 164 | 175 | 224 | 244 | 142 | 186 | 208 |
| 2017 | 165 | 144 | 167 | 128 | 119 | 135 | 140 | 161 | 208 | 171 | 163 | 159 |
| 2018 | 143 | 116 | 70 | 119 | 161 | 151 | 156 | 161 | 141 | 163 | 132 | 147 |
| 2019 | 141 | 120 | 134 | 140 | 147 | 114 | 64 | 24 | 137 | 152 | 149 | 117 |
| 2020 | 103 | 110 | 0 | 37 | 42 | 34 | 41 | 31 | 127 | 119 | 40 | |
| 2021 | 40 | 24 | 40 | 48 | 38 | 38 | 64 | 114 | 33 | 69 | 102 | 38 |
| 2022 | 38 | 30 | 31 | 28 | 48 | 37 | 72 | 43 | 26 | 28 | 37 | 30 |
| 2023 | 24 | 32 | 44 | 38 | 34 | 31 | 40 | 48 | 30 | 35 | 26 | |
| 2024 | 2 | 4 | 30 | 1 | 1 | 2 | 1 | 2 | 2 | 1 | ||
| 2025 | 1 | 2 | ||||||||||
| - = No Data Reported; -- = Not Applicable; NA = Not Available; W = Withheld to avoid disclosure of individual company data. |
| Release Date: 6/30/2025 |
| Next Release Date: 7/31/2025 |
Referring Pages: