|
Download Data (XLS File) |
|
||||||||
|
||||||||
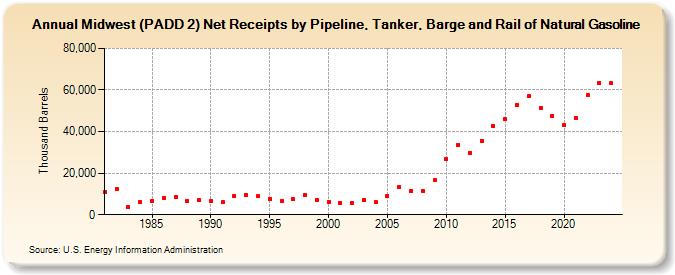
| Midwest (PADD 2) Net Receipts by Pipeline, Tanker, Barge and Rail of Natural Gasoline (Thousand Barrels) | ||||||||
| Decade | Year-0 | Year-1 | Year-2 | Year-3 | Year-4 | Year-5 | Year-6 | Year-7 | Year-8 | Year-9 |
|---|---|---|---|---|---|---|---|---|---|---|
| 1980's | 10,969 | 12,392 | 3,583 | 6,210 | 6,614 | 8,175 | 8,446 | 6,422 | 7,218 | |
| 1990's | 6,520 | 5,892 | 8,810 | 9,568 | 8,818 | 7,671 | 6,597 | 7,413 | 9,301 | 7,312 |
| 2000's | 6,168 | 5,858 | 5,484 | 7,140 | 6,224 | 9,106 | 13,126 | 11,245 | 11,422 | 16,553 |
| 2010's | 26,681 | 33,706 | 29,889 | 35,650 | 42,479 | 46,031 | 52,603 | 57,202 | 51,387 | 47,541 |
| 2020's | 43,134 | 46,697 | 57,501 | 63,381 |
| - = No Data Reported; -- = Not Applicable; NA = Not Available; W = Withheld to avoid disclosure of individual company data. |
| Release Date: 3/29/2024 |
| Next Release Date: 8/30/2024 |