|
Download Data (XLS File) |
|
||||||||
|
||||||||
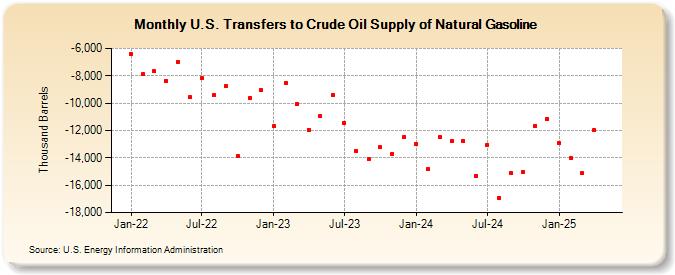
| U.S. Transfers to Crude Oil Supply of Natural Gasoline (Thousand Barrels) | ||||||||
| Year | Jan | Feb | Mar | Apr | May | Jun | Jul | Aug | Sep | Oct | Nov | Dec |
|---|---|---|---|---|---|---|---|---|---|---|---|---|
| 2022 | -6,412 | -7,890 | -7,677 | -8,358 | -6,966 | -9,588 | -8,158 | -9,410 | -8,757 | -13,890 | -9,642 | -9,074 |
| 2023 | -10,641 | -7,924 | -9,658 | -10,972 | -14,075 | -12,462 | -12,936 | -15,551 | -15,692 | -15,734 | -13,638 | -12,396 |
| 2024 | -13,016 | -14,801 | ||||||||||
| - = No Data Reported; -- = Not Applicable; NA = Not Available; W = Withheld to avoid disclosure of individual company data. |
| Release Date: 4/30/2024 |
| Next Release Date: 5/31/2024 |
Referring Pages: