|
Download Data (XLS File) |
|
||||||||
|
||||||||
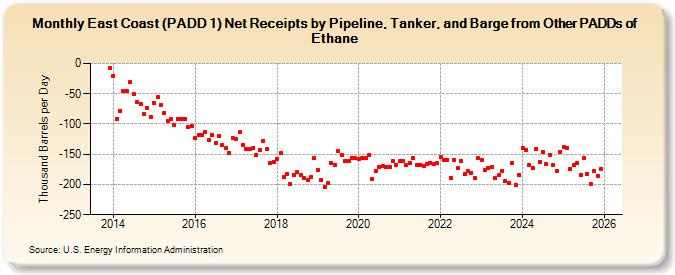
| East Coast (PADD 1) Net Receipts by Pipeline, Tanker, and Barge from Other PADDs of Ethane (Thousand Barrels per Day) | ||||||||
| Year | Jan | Feb | Mar | Apr | May | Jun | Jul | Aug | Sep | Oct | Nov | Dec |
|---|---|---|---|---|---|---|---|---|---|---|---|---|
| 2013 | -8 | |||||||||||
| 2014 | -20 | -91 | -78 | -46 | -45 | -31 | -51 | -63 | -67 | -83 | -74 | -88 |
| 2015 | -66 | -56 | -68 | -82 | -95 | -92 | -101 | -92 | -91 | -92 | -105 | -104 |
| 2016 | -124 | -118 | -119 | -114 | -126 | -119 | -132 | -120 | -135 | -140 | -148 | -123 |
| 2017 | -125 | -114 | -135 | -141 | -141 | -140 | -151 | -143 | -128 | -141 | -164 | -163 |
| 2018 | -158 | -148 | -188 | -182 | -200 | -185 | -180 | -185 | -190 | -193 | -188 | -156 |
| 2019 | -176 | -192 | -204 | -198 | -165 | -167 | -145 | -152 | -161 | -161 | -156 | -157 |
| 2020 | -158 | -156 | -156 | -151 | -191 | -178 | -171 | -170 | -171 | -171 | -162 | -167 |
| 2021 | -162 | -161 | -168 | -165 | -157 | -167 | -167 | -169 | -166 | -164 | -166 | -165 |
| 2022 | -155 | -160 | -159 | -189 | -159 | -172 | -161 | -183 | -178 | -181 | -190 | -157 |
| 2023 | -159 | -176 | -173 | -171 | -190 | -185 | -177 | -195 | -198 | -164 | -201 | -185 |
| 2024 | -139 | |||||||||||
| - = No Data Reported; -- = Not Applicable; NA = Not Available; W = Withheld to avoid disclosure of individual company data. |
| Release Date: 3/29/2024 |
| Next Release Date: 4/30/2024 |
Referring Pages: