|
Download Data (XLS File) |
|
||||||||
|
||||||||
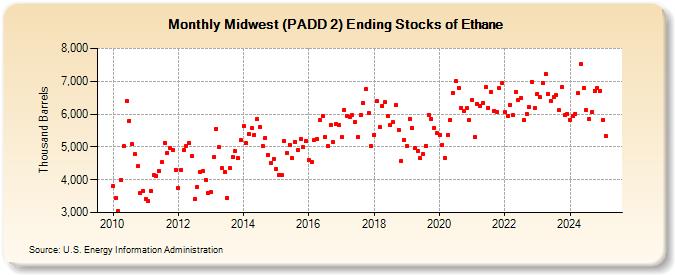
| Midwest (PADD 2) Ending Stocks of Ethane (Thousand Barrels) | ||||||||
| Year | Jan | Feb | Mar | Apr | May | Jun | Jul | Aug | Sep | Oct | Nov | Dec |
|---|---|---|---|---|---|---|---|---|---|---|---|---|
| 2010 | 3,802 | 3,440 | 3,051 | 3,992 | 5,012 | 6,388 | 5,798 | 5,076 | 4,774 | 4,405 | 3,596 | 3,669 |
| 2011 | 3,418 | 3,352 | 3,660 | 4,133 | 4,128 | 4,261 | 4,525 | 5,132 | 4,818 | 4,976 | 4,908 | 4,306 |
| 2012 | 3,763 | 4,292 | 4,918 | 5,037 | 5,124 | 4,716 | 3,422 | 3,790 | 4,246 | 4,258 | 3,996 | 3,590 |
| 2013 | 3,614 | 4,686 | 5,554 | 4,984 | 4,352 | 4,235 | 3,452 | 4,355 | 4,694 | 4,874 | 4,649 | 5,202 |
| 2014 | 5,636 | 5,113 | 5,399 | 5,561 | 5,369 | 5,849 | 5,607 | 5,025 | 5,286 | 4,768 | 4,524 | 4,625 |
| 2015 | 4,337 | 4,146 | 4,141 | 5,175 | 4,820 | 5,067 | 4,665 | 5,161 | 4,917 | 5,241 | 4,991 | 5,182 |
| 2016 | 4,589 | 4,553 | 5,223 | 5,244 | 5,804 | 5,937 | 5,297 | 5,012 | 5,678 | 5,138 | 5,701 | 5,681 |
| 2017 | 5,305 | 6,127 | 5,948 | 5,919 | 5,957 | 5,764 | 5,287 | 5,972 | 6,331 | 6,749 | 6,029 | 5,033 |
| 2018 | 5,374 | 6,386 | 5,594 | 6,255 | 6,358 | 5,934 | 5,654 | 5,748 | 6,270 | 5,519 | 4,581 | 5,211 |
| 2019 | 5,021 | 5,850 | 5,580 | 4,973 | 4,883 | 4,652 | 4,782 | 5,042 | 5,978 | 5,856 | 5,590 | 5,415 |
| 2020 | 5,374 | 5,065 | 4,663 | 5,356 | 5,830 | 6,654 | 7,005 | 6,798 | 6,193 | 6,096 | 6,176 | 5,815 |
| 2021 | 6,443 | 5,291 | 6,306 | 6,255 | 6,341 | 6,810 | 6,196 | 6,671 | 6,095 | 6,073 | 6,785 | 6,933 |
| 2022 | 6,062 | 5,954 | 6,285 | 5,959 | 6,659 | 6,441 | 6,484 | 5,806 | 6,008 | 6,219 | 6,990 | 6,195 |
| 2023 | 6,623 | 6,508 | 6,957 | 7,220 | 6,622 | 6,399 | 6,527 | 6,572 | 6,113 | 6,814 | 5,967 | 6,002 |
| 2024 | 5,827 | 5,949 | 6,015 | 6,628 | ||||||||
| - = No Data Reported; -- = Not Applicable; NA = Not Available; W = Withheld to avoid disclosure of individual company data. |
| Release Date: 6/28/2024 |
| Next Release Date: 7/31/2024 |