|
Download Data (XLS File) |
|
||||||||
|
||||||||
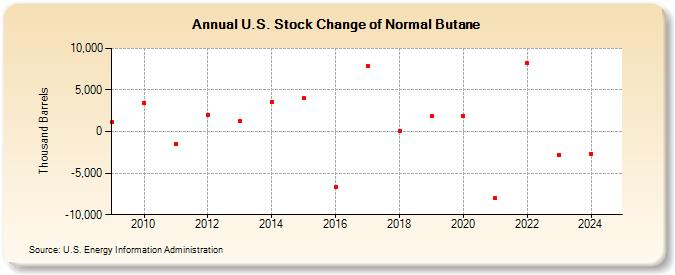
| U.S. Stock Change of Normal Butane (Thousand Barrels) | ||||||||
| Decade | Year-0 | Year-1 | Year-2 | Year-3 | Year-4 | Year-5 | Year-6 | Year-7 | Year-8 | Year-9 |
|---|---|---|---|---|---|---|---|---|---|---|
| 2000's | 1,118 | |||||||||
| 2010's | 3,407 | -1,527 | 2,002 | 1,231 | 3,596 | 4,032 | -6,703 | 7,939 | 13 | 1,837 |
| 2020's | 1,883 | -7,996 | 8,207 | -2,848 |
| - = No Data Reported; -- = Not Applicable; NA = Not Available; W = Withheld to avoid disclosure of individual company data. |
| Release Date: 6/28/2024 |
| Next Release Date: 8/30/2024 |
Referring Pages: