|
Download Data (XLS File) |
|
||||||||
|
||||||||
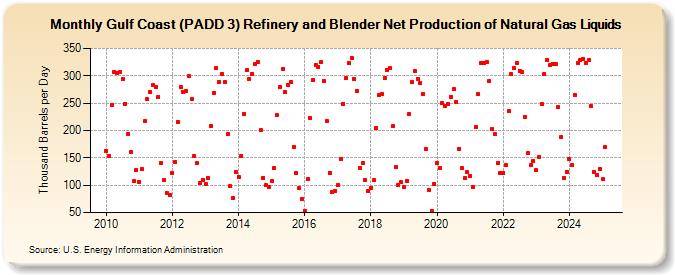
| Gulf Coast (PADD 3) Refinery and Blender Net Production of Natural Gas Liquids (Thousand Barrels per Day) | ||||||||
| Year | Jan | Feb | Mar | Apr | May | Jun | Jul | Aug | Sep | Oct | Nov | Dec |
|---|---|---|---|---|---|---|---|---|---|---|---|---|
| 2010 | 163 | 154 | 247 | 307 | 305 | 306 | 294 | 249 | 194 | 160 | 107 | 128 |
| 2011 | 106 | 130 | 217 | 257 | 270 | 283 | 280 | 262 | 141 | 109 | 86 | 83 |
| 2012 | 123 | 143 | 216 | 279 | 271 | 273 | 299 | 257 | 153 | 140 | 104 | 110 |
| 2013 | 102 | 113 | 209 | 269 | 314 | 289 | 304 | 288 | 193 | 98 | 77 | 124 |
| 2014 | 115 | 154 | 231 | 310 | 294 | 304 | 321 | 326 | 200 | 114 | 100 | 97 |
| 2015 | 108 | 131 | 228 | 279 | 312 | 270 | 284 | 288 | 170 | 122 | 94 | 75 |
| 2016 | 53 | 112 | 222 | 293 | 320 | 316 | 325 | 291 | 217 | 123 | 87 | 90 |
| 2017 | 100 | 147 | 249 | 295 | 324 | 333 | 294 | 273 | 131 | 140 | 109 | 90 |
| 2018 | 95 | 109 | 204 | 264 | 267 | 295 | 311 | 314 | 208 | 133 | 100 | 105 |
| 2019 | 96 | 108 | 230 | 288 | 308 | 294 | 287 | 267 | 166 | 92 | 53 | 103 |
| 2020 | 141 | 131 | 250 | 244 | 249 | 262 | 275 | 252 | 167 | 131 | 113 | 124 |
| 2021 | 117 | 96 | 206 | 267 | 323 | 323 | 325 | 290 | 203 | 193 | 141 | 123 |
| 2022 | 123 | 136 | 236 | 303 | 314 | 323 | 309 | 307 | 225 | 159 | 136 | 145 |
| 2023 | 127 | 151 | 249 | 304 | 328 | 320 | 322 | 321 | 243 | 188 | 113 | 125 |
| 2024 | 147 | 136 | 265 | 324 | 329 | 331 | 324 | 329 | 244 | 124 | 119 | 130 |
| 2025 | 111 | 169 | 290 | 322 | ||||||||
| - = No Data Reported; -- = Not Applicable; NA = Not Available; W = Withheld to avoid disclosure of individual company data. |
| Release Date: 6/30/2025 |
| Next Release Date: 7/31/2025 |