|
Download Data (XLS File) |
|
||||||||
|
||||||||
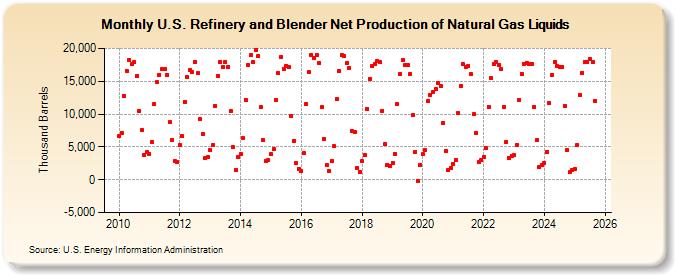
| U.S. Refinery and Blender Net Production of Natural Gas Liquids (Thousand Barrels) | ||||||||
| Year | Jan | Feb | Mar | Apr | May | Jun | Jul | Aug | Sep | Oct | Nov | Dec |
|---|---|---|---|---|---|---|---|---|---|---|---|---|
| 2010 | 6,663 | 7,169 | 12,796 | 16,604 | 18,230 | 17,574 | 17,868 | 15,828 | 10,459 | 7,608 | 3,705 | 4,188 |
| 2011 | 3,965 | 5,718 | 11,567 | 14,833 | 15,972 | 16,820 | 16,844 | 16,014 | 8,821 | 6,007 | 2,888 | 2,681 |
| 2012 | 5,321 | 6,636 | 11,909 | 15,637 | 16,683 | 16,394 | 17,899 | 16,205 | 9,194 | 6,928 | 3,241 | 3,459 |
| 2013 | 4,501 | 5,344 | 11,248 | 15,803 | 17,990 | 17,140 | 17,925 | 17,183 | 10,456 | 4,978 | 1,538 | 3,471 |
| 2014 | 3,883 | 6,304 | 12,192 | 17,440 | 18,945 | 17,909 | 19,738 | 18,874 | 11,040 | 5,984 | 2,900 | 2,944 |
| 2015 | 3,847 | 4,674 | 12,202 | 16,266 | 18,740 | 16,922 | 17,369 | 17,114 | 9,720 | 5,951 | 2,501 | 1,704 |
| 2016 | 1,288 | 4,079 | 11,534 | 16,378 | 18,980 | 18,557 | 19,039 | 17,780 | 11,057 | 6,267 | 2,172 | 1,321 |
| 2017 | 2,912 | 5,096 | 12,274 | 16,599 | 18,948 | 18,907 | 17,823 | 17,077 | 7,370 | 7,235 | 1,828 | 1,201 |
| 2018 | 2,804 | 3,691 | 10,809 | 15,368 | 17,354 | 17,619 | 18,016 | 17,903 | 10,539 | 5,365 | 2,240 | 2,136 |
| 2019 | 2,564 | 3,984 | 11,529 | 16,101 | 18,308 | 17,452 | 17,405 | 16,115 | 9,902 | 4,297 | -118 | 2,299 |
| 2020 | 3,859 | 4,503 | 11,951 | 12,917 | 13,364 | 13,840 | 14,738 | 14,202 | 8,685 | 4,435 | 1,420 | 1,850 |
| 2021 | 2,458 | 2,956 | 10,139 | 14,337 | 17,553 | 17,184 | 17,374 | 16,096 | 9,967 | 7,138 | 2,636 | 2,954 |
| 2022 | 3,451 | 4,830 | 11,132 | 15,430 | 17,577 | 17,854 | 17,487 | 16,851 | 11,097 | 5,756 | 3,316 | 3,664 |
| 2023 | 3,753 | 5,314 | 12,185 | 16,121 | 17,667 | 17,810 | 17,596 | 17,699 | 11,133 | 6,073 | 1,967 | 2,203 |
| 2024 | 3,480 | |||||||||||
| - = No Data Reported; -- = Not Applicable; NA = Not Available; W = Withheld to avoid disclosure of individual company data. |
| Release Date: 3/29/2024 |
| Next Release Date: 4/30/2024 |