|
Download Data (XLS File) |
|
||||||||
|
||||||||
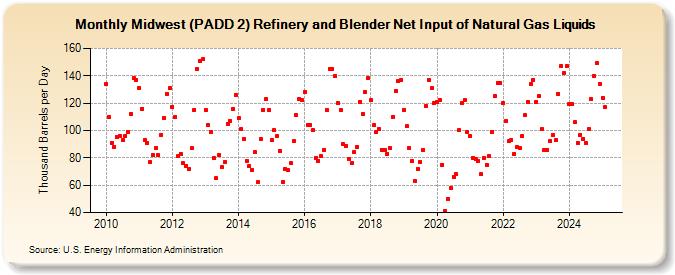
| Midwest (PADD 2) Refinery and Blender Net Input of Natural Gas Liquids (Thousand Barrels per Day) | ||||||||
| Year | Jan | Feb | Mar | Apr | May | Jun | Jul | Aug | Sep | Oct | Nov | Dec |
|---|---|---|---|---|---|---|---|---|---|---|---|---|
| 2010 | 134 | 110 | 91 | 88 | 95 | 96 | 93 | 96 | 99 | 112 | 138 | 137 |
| 2011 | 131 | 116 | 93 | 91 | 77 | 82 | 87 | 82 | 97 | 109 | 127 | 131 |
| 2012 | 117 | 110 | 81 | 83 | 76 | 74 | 72 | 87 | 115 | 145 | 151 | 152 |
| 2013 | 115 | 104 | 99 | 80 | 65 | 82 | 73 | 77 | 105 | 107 | 116 | 126 |
| 2014 | 109 | 101 | 94 | 78 | 74 | 71 | 84 | 62 | 94 | 115 | 123 | 115 |
| 2015 | 93 | 100 | 96 | 85 | 62 | 72 | 71 | 76 | 92 | 111 | 123 | 122 |
| 2016 | 128 | 104 | 104 | 100 | 80 | 78 | 81 | 86 | 115 | 145 | 145 | 140 |
| 2017 | 120 | 115 | 90 | 89 | 79 | 76 | 84 | 88 | 121 | 112 | 128 | 138 |
| 2018 | 122 | 104 | 99 | 101 | 86 | 86 | 83 | 87 | 110 | 129 | 136 | 137 |
| 2019 | 115 | 103 | 87 | 78 | 63 | 72 | 77 | 86 | 118 | 137 | 131 | 120 |
| 2020 | 121 | 122 | 75 | 41 | 50 | 58 | 66 | 68 | 100 | 120 | 122 | 99 |
| 2021 | 96 | 80 | 79 | 78 | 68 | 80 | 75 | 81 | 99 | 125 | 135 | 135 |
| 2022 | 120 | 107 | 92 | 93 | 83 | 88 | 87 | 96 | 111 | 121 | 134 | 137 |
| 2023 | 121 | 125 | 101 | 86 | 86 | 92 | 97 | 93 | 127 | 147 | 142 | 147 |
| 2024 | 119 | 119 | 106 | 91 | 97 | 94 | 91 | 101 | 123 | 140 | 149 | 134 |
| 2025 | 124 | 117 | 91 | 76 | ||||||||
| - = No Data Reported; -- = Not Applicable; NA = Not Available; W = Withheld to avoid disclosure of individual company data. |
| Release Date: 6/30/2025 |
| Next Release Date: 7/31/2025 |