|
Download Data (XLS File) |
|
||||||||
|
||||||||
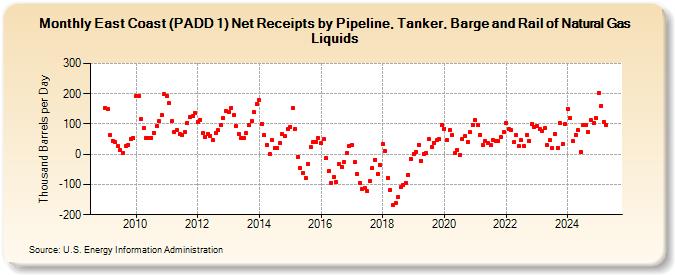
| East Coast (PADD 1) Net Receipts by Pipeline, Tanker, Barge and Rail of Natural Gas Liquids (Thousand Barrels per Day) | ||||||||
| Year | Jan | Feb | Mar | Apr | May | Jun | Jul | Aug | Sep | Oct | Nov | Dec |
|---|---|---|---|---|---|---|---|---|---|---|---|---|
| 2009 | 153 | 151 | 63 | 45 | 39 | 26 | 13 | 4 | 26 | 32 | 51 | 53 |
| 2010 | 191 | 193 | 115 | 86 | 55 | 55 | 55 | 71 | 92 | 109 | 129 | 198 |
| 2011 | 191 | 168 | 109 | 74 | 80 | 66 | 62 | 72 | 104 | 122 | 127 | 136 |
| 2012 | 107 | 114 | 70 | 57 | 67 | 60 | 46 | 71 | 79 | 95 | 120 | 143 |
| 2013 | 138 | 153 | 129 | 94 | 67 | 53 | 53 | 69 | 96 | 109 | 138 | 167 |
| 2014 | 180 | 101 | 62 | 31 | 0 | 48 | 21 | 19 | 37 | 67 | 59 | 83 |
| 2015 | 91 | 152 | 84 | -8 | -45 | -62 | -77 | -31 | 24 | 40 | 42 | 53 |
| 2016 | 36 | 49 | -14 | -55 | -94 | -74 | -93 | -31 | -43 | -25 | 4 | 26 |
| 2017 | 32 | -27 | -66 | -96 | -114 | -112 | -123 | -90 | -45 | -18 | -65 | -35 |
| 2018 | 34 | 10 | -79 | -118 | -169 | -161 | -141 | -109 | -101 | -95 | -68 | -15 |
| 2019 | 1 | 8 | 32 | -21 | 1 | 4 | 50 | 24 | 38 | 46 | 50 | 98 |
| 2020 | 85 | 46 | 80 | 64 | 3 | 15 | -2 | 49 | 59 | 41 | 72 | 98 |
| 2021 | 113 | 96 | 64 | 31 | 43 | 37 | 29 | 46 | 44 | 43 | 56 | 74 |
| 2022 | 103 | 82 | 79 | 40 | 63 | 26 | 46 | 26 | 65 | 45 | 101 | 90 |
| 2023 | 94 | 82 | 78 | 86 | 29 | 46 | 21 | 67 | 20 | 102 | 35 | 101 |
| 2024 | 150 | 119 | 43 | 65 | 79 | 7 | 95 | 97 | 72 | 112 | 103 | 119 |
| 2025 | 203 | 160 | 107 | 98 | ||||||||
| - = No Data Reported; -- = Not Applicable; NA = Not Available; W = Withheld to avoid disclosure of individual company data. |
| Release Date: 6/30/2025 |
| Next Release Date: 7/31/2025 |