|
Download Data (XLS File) |
|
||||||||
|
||||||||
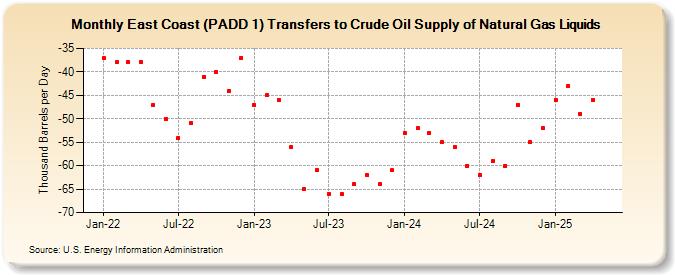
| East Coast (PADD 1) Transfers to Crude Oil Supply of Natural Gas Liquids (Thousand Barrels per Day) | ||||||||
| Year | Jan | Feb | Mar | Apr | May | Jun | Jul | Aug | Sep | Oct | Nov | Dec |
|---|---|---|---|---|---|---|---|---|---|---|---|---|
| 2022 | -37 | -38 | -38 | -38 | -47 | -50 | -54 | -51 | -41 | -40 | -44 | -37 |
| 2023 | -47 | -45 | -46 | -56 | -65 | -61 | -66 | -66 | -64 | -62 | -64 | -61 |
| 2024 | -53 | -52 | -53 | -55 | -56 | -60 | -62 | -59 | -60 | -47 | -55 | -52 |
| 2025 | -46 | -43 | -49 | -46 | ||||||||
| - = No Data Reported; -- = Not Applicable; NA = Not Available; W = Withheld to avoid disclosure of individual company data. |
| Release Date: 6/30/2025 |
| Next Release Date: 7/31/2025 |