|
Download Data (XLS File) |
|
||||||||
|
||||||||
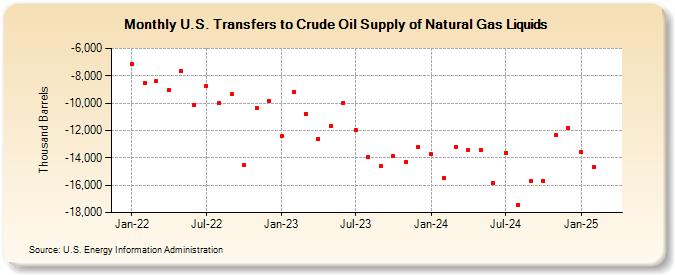
| U.S. Transfers to Crude Oil Supply of Natural Gas Liquids (Thousand Barrels) | ||||||||
| Year | Jan | Feb | Mar | Apr | May | Jun | Jul | Aug | Sep | Oct | Nov | Dec |
|---|---|---|---|---|---|---|---|---|---|---|---|---|
| 2022 | -7,149 | -8,563 | -8,406 | -9,054 | -7,648 | -10,141 | -8,765 | -10,017 | -9,365 | -14,552 | -10,343 | -9,814 |
| 2023 | -11,385 | -8,578 | -10,368 | -11,638 | -14,738 | -13,039 | -13,461 | -16,002 | -16,150 | -16,368 | -14,249 | -13,107 |
| 2024 | -13,727 | -15,467 | ||||||||||
| - = No Data Reported; -- = Not Applicable; NA = Not Available; W = Withheld to avoid disclosure of individual company data. |
| Release Date: 4/30/2024 |
| Next Release Date: 5/31/2024 |
Referring Pages: