|
Download Data (XLS File) |
|
||||||||
|
||||||||
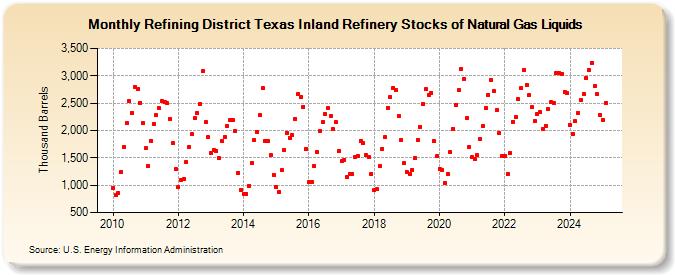
| Refining District Texas Inland Refinery Stocks of Natural Gas Liquids (Thousand Barrels) | ||||||||
| Year | Jan | Feb | Mar | Apr | May | Jun | Jul | Aug | Sep | Oct | Nov | Dec |
|---|---|---|---|---|---|---|---|---|---|---|---|---|
| 2010 | 953 | 824 | 860 | 1,238 | 1,705 | 2,128 | 2,532 | 2,324 | 2,802 | 2,753 | 2,507 | 2,128 |
| 2011 | 1,673 | 1,350 | 1,813 | 2,124 | 2,277 | 2,404 | 2,540 | 2,519 | 2,496 | 2,218 | 1,763 | 1,300 |
| 2012 | 958 | 1,091 | 1,113 | 1,427 | 1,707 | 1,929 | 2,227 | 2,320 | 2,475 | 3,082 | 2,154 | 1,873 |
| 2013 | 1,597 | 1,649 | 1,634 | 1,490 | 1,812 | 1,882 | 2,086 | 2,188 | 2,191 | 1,991 | 1,223 | 916 |
| 2014 | 843 | 848 | 994 | 1,411 | 1,818 | 1,979 | 2,282 | 2,768 | 1,814 | 1,805 | 1,544 | 1,192 |
| 2015 | 965 | 882 | 1,276 | 1,645 | 1,959 | 1,868 | 1,915 | 2,218 | 2,672 | 2,613 | 2,433 | 1,667 |
| 2016 | 1,058 | 1,063 | 1,348 | 1,608 | 1,988 | 2,149 | 2,304 | 2,403 | 2,265 | 2,020 | 2,150 | 1,633 |
| 2017 | 1,444 | 1,467 | 1,143 | 1,207 | 1,209 | 1,510 | 1,534 | 1,814 | 1,769 | 1,547 | 1,513 | 1,205 |
| 2018 | 909 | 922 | 1,342 | 1,663 | 1,873 | 2,413 | 2,616 | 2,782 | 2,739 | 2,264 | 1,822 | 1,402 |
| 2019 | 1,235 | 1,202 | 1,283 | 1,494 | 1,832 | 2,071 | 2,491 | 2,753 | 2,651 | 2,685 | 1,801 | 1,526 |
| 2020 | 1,299 | 1,270 | 1,046 | 1,208 | 1,605 | 2,033 | 2,457 | 2,733 | 3,127 | 2,949 | 2,219 | 1,705 |
| 2021 | 1,510 | 1,475 | 1,545 | 1,840 | 2,075 | 2,409 | 2,657 | 2,925 | 2,715 | 2,372 | 1,958 | 1,532 |
| 2022 | 1,530 | 1,201 | 1,589 | 2,162 | 2,246 | 2,574 | 2,769 | 3,106 | 2,833 | 2,647 | 2,424 | 2,167 |
| 2023 | 2,305 | 2,333 | 2,031 | 2,088 | 2,394 | 2,520 | 2,495 | 3,047 | 3,051 | 3,039 | 2,711 | 2,683 |
| 2024 | 2,107 | 1,940 | 2,165 | 2,325 | ||||||||
| - = No Data Reported; -- = Not Applicable; NA = Not Available; W = Withheld to avoid disclosure of individual company data. |
| Release Date: 6/28/2024 |
| Next Release Date: 7/31/2024 |
Referring Pages: