|
Download Data (XLS File) |
|
||||||||
|
||||||||
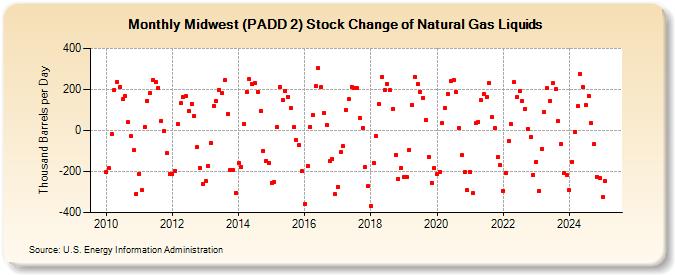
| Midwest (PADD 2) Stock Change of Natural Gas Liquids (Thousand Barrels per Day) | ||||||||
| Year | Jan | Feb | Mar | Apr | May | Jun | Jul | Aug | Sep | Oct | Nov | Dec |
|---|---|---|---|---|---|---|---|---|---|---|---|---|
| 2010 | -203 | -185 | -18 | 199 | 238 | 213 | 153 | 169 | 39 | -27 | -97 | -308 |
| 2011 | -210 | -292 | 18 | 146 | 183 | 247 | 234 | 208 | 47 | -2 | -112 | -213 |
| 2012 | -212 | -197 | 30 | 132 | 161 | 166 | 96 | 131 | 71 | -81 | -182 | -262 |
| 2013 | -248 | -173 | -60 | 121 | 144 | 199 | 182 | 244 | 80 | -193 | -191 | -304 |
| 2014 | -159 | -178 | 31 | 187 | 250 | 225 | 230 | 189 | 94 | -99 | -147 | -157 |
| 2015 | -255 | -250 | 15 | 211 | 147 | 192 | 165 | 109 | 16 | -44 | -70 | -199 |
| 2016 | -360 | -173 | 16 | 75 | 215 | 303 | 213 | 87 | 26 | -150 | -141 | -311 |
| 2017 | -274 | -106 | -77 | 101 | 152 | 212 | 205 | 205 | 61 | 14 | -180 | -271 |
| 2018 | -369 | -158 | -27 | 127 | 261 | 196 | 227 | 196 | 105 | -118 | -235 | -182 |
| 2019 | -227 | -229 | -93 | 126 | 261 | 226 | 188 | 159 | 53 | -127 | -255 | -185 |
| 2020 | -212 | -200 | 34 | 111 | 179 | 240 | 248 | 186 | 10 | -120 | -203 | -292 |
| 2021 | -201 | -307 | 34 | 42 | 147 | 179 | 164 | 231 | 64 | 10 | -131 | -170 |
| 2022 | -293 | -207 | -52 | 30 | 234 | 162 | 192 | 144 | 107 | 8 | -31 | -218 |
| 2023 | -153 | -290 | -83 | 87 | 205 | 132 | 234 | 195 | 50 | -57 | -206 | -216 |
| 2024 | -292 | |||||||||||
| - = No Data Reported; -- = Not Applicable; NA = Not Available; W = Withheld to avoid disclosure of individual company data. |
| Release Date: 3/29/2024 |
| Next Release Date: 4/30/2024 |